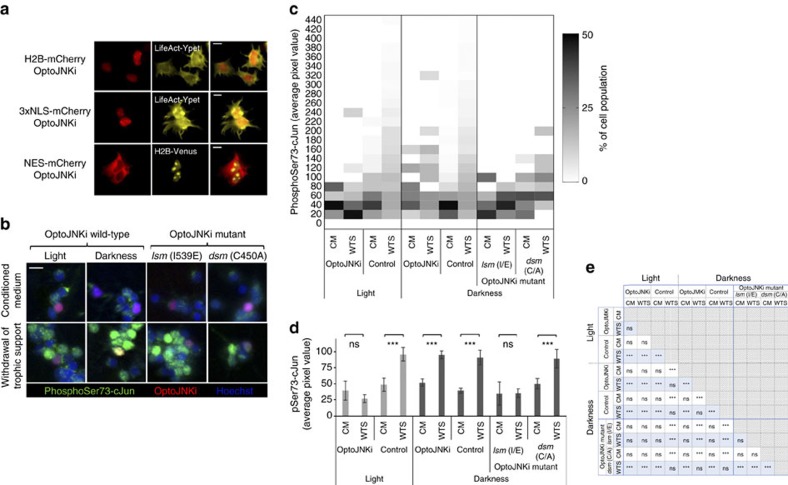
Figure 4. Gene transfer of OptoJNKi inhibits endogenous c-Jun phosphorylation in intact neuronal cells.
(a) OptoJNKi is constrained to different subcellular compartments by fusion to targeting sequences H2B, 3 × NLS or NES together with mCherry to confirm localization visually in 293T cells with the assistance of cotransfected markers for F-actin (LifeAct-Ypet) or nucleus (H2B-Venus) as indicated. Scale bars, 10 μm. (b) Neuronal cultures immunostained for phosphorylation of JNK substrate c-Jun to measure the effect NLS-OptoJNKi on nuclear JNK signalling. WTS (lower panels) for 4 h increases nuclear p-Jun staining (green; DNA counter-stained in blue), when OptoJNKi-expressing cells (red) are kept dark or OptoJNKi.dsm is used (second and fourth column of panels). This is rare in illuminated or OptoJNKi.lsm expressing cells (first and third column), which show nuclear p-Jun responses predominantly in untransfected neighbour cells. CM controls show little nuclear p-Jun staining (upper panels). Scale bar, 10 μm. (c) The population distribution heat map of nuclear phospho-Jun responses of neurons shows minimal WTS-evoked pSer73-cJun response in OptoJNKi-transfected under white-light illumination. Quantified pJun immunostaining signal for each segmented nucleus positive for red fluorescence, an indicator of the mCherry-fused NLS-OptoJNKi variants used, was included under categories OptoJNKi, OptoJNKi.lsm or OptoJNKi.dsm. pJun signal from all mCherry-negative neighbouring cells was included in the control category. Most cells in CM have lower pSer73-cJun staining in all cases, whereas WTS shifts the population profile to higher p-Jun levels. The exceptions are the illumination/OptoJNKi (second column) and darkness/optoJNKi.lsm (10th column) conditions. (d) Average levels of pSer73-cJun per segmented nucleus are shown here for all conditions—with or without illumination, WTS and mCherry transfection marker. Only illumination of OptoJNKi-transfected cells led to complete suppression of the phospho-c-Jun response. Selected statistical comparisons from the complete analysis in Fig. 4e are shown above the bars to highlight significant changes induced by WTS (mean±s.e.m., n=3 or 9 in the case of untransfected controls). (e) Full statistical analysis of all conditions represented in Fig. 4d, by two-way ANOVA with Neuman–Keuls post-test, presented as a table where ns denotes non-significant, *P<0.05, **P< 0.01 and ***P<0.001.

