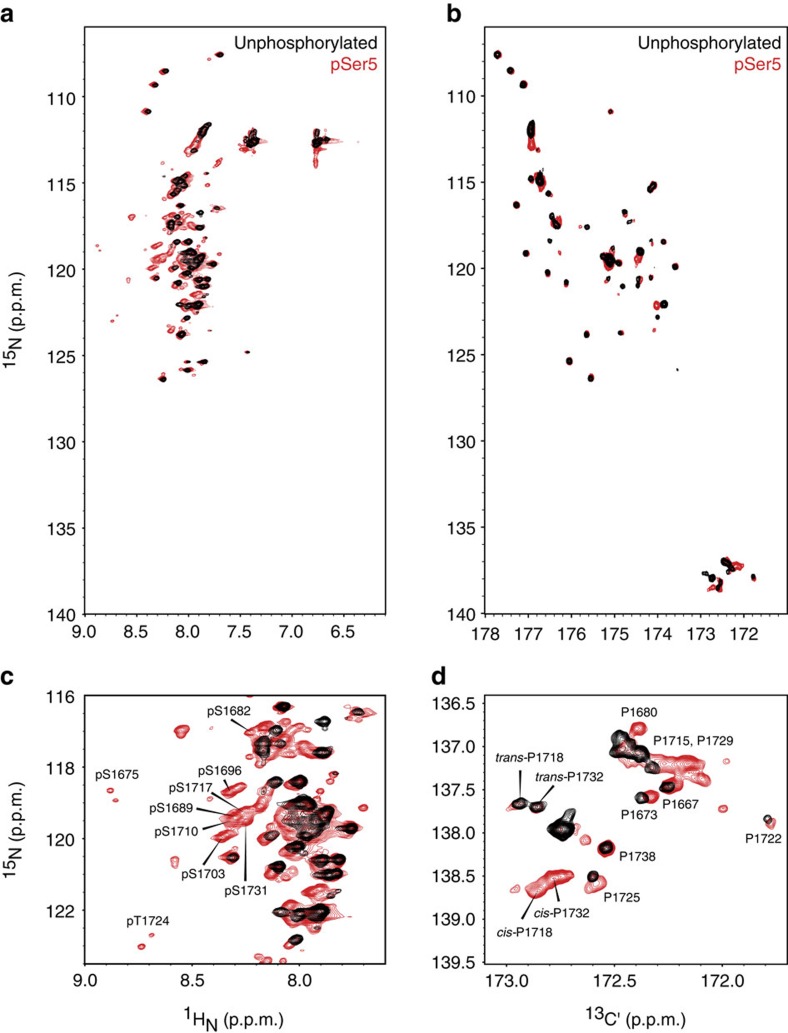
Figure 3. Phospho-sites and proline isomerization in hyper-pSer5 CTD2′ probed by NMR spectroscopy.
(a) 2D 1H-15N correlation spectra of unphosphorylated (black) and hyper-pSer5 (red) CTD2′. (b) 2D 13C′-15N correlation spectra of unphosphorylated (black) and hyper-pSer5 (red) CTD2′. (c) Annotation of pSer5/pThr5 resonances in the downfield region of the 2D H-N correlation spectrum. (d) Proline region from the 2D C′-N correlation spectrum of unphosphorylated (black) and hyper-pSer5 (red) CTD2′ with some proline resonances annotated.

