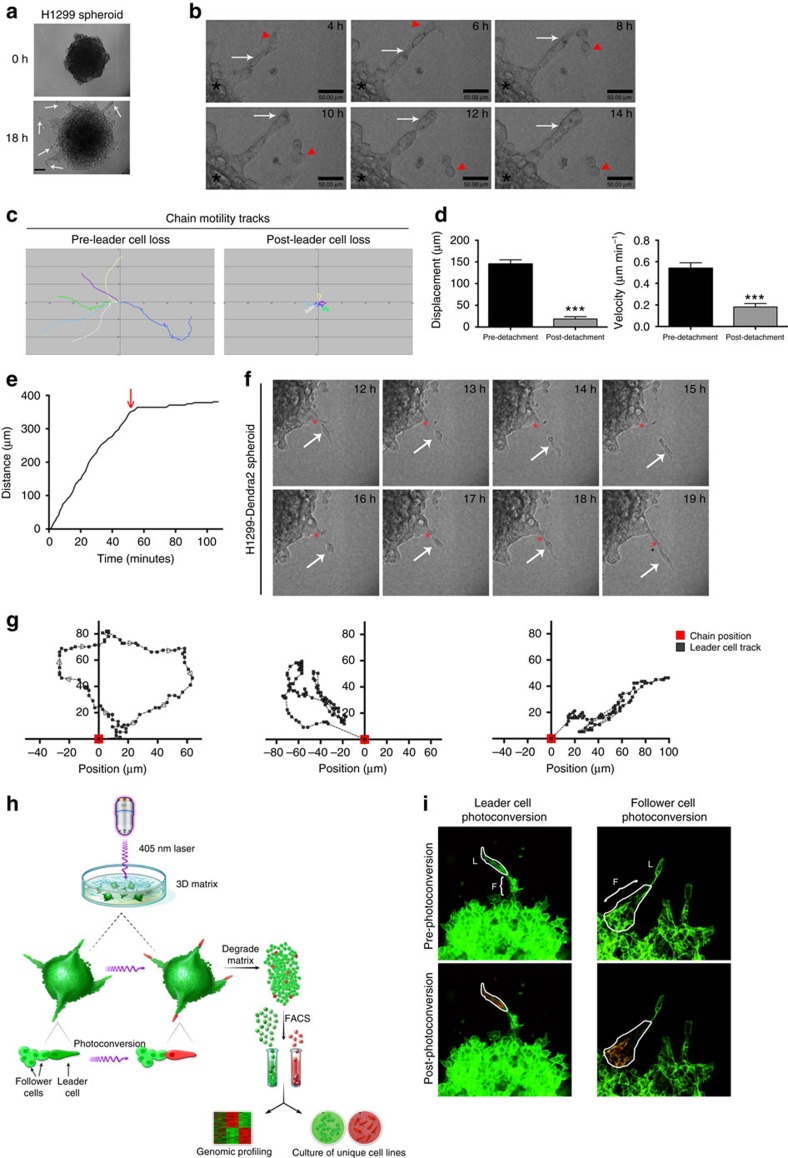
Figure 1. Leader cells represent a specialized subpopulation which can be purified using SaGA.
(a) H1299 spheroids were imaged at 0 h (top) and 18 h (bottom) post embedding. Arrows, leader–follower invasive chains. (b–f) H1299 spheroids imaged using live cell confocal imaging. (b) Time lapse of H1299 spheroids acquired every 2 h. Arrow, follower cells in invasive chain; arrowhead, leader cell. (c) Invasive chains were tracked over time before (pre-leader cell loss) and after (post-leader cell loss) a leader cell becomes detached from the chain. Cell track plots are shown where each colour represents a single chain. (d) Quantification of track displacement and velocity of invasive chains from c. n=6. Error bars denote the s.e.m. ***P<0.001, using a Student's t-test. (e) Single invasive chain distance tracked over time. Arrow=point of leader cell detachment. (f) Representative still images of live cell imaging of H1299 spheroids taken every hour. Arrow denotes the leader cell, asterisk denotes the follower cell chain. (g) Three leader cells were tracked after the time of detachment from the rest of the chain. The position of each leader cell (grey track) is plotted relative to the position of the chain from which it detached (red point). (h) Schematic showing the process of the SaGA technique (see methodology for details). Printed with permission from Fairman Studios, LLC. This image is not included in the Creative Commons licence for the article. (i) Photoconversion examples using 3D spheroids of H1299-Dendra2 cells. F, follower cells; L, leader cell.

