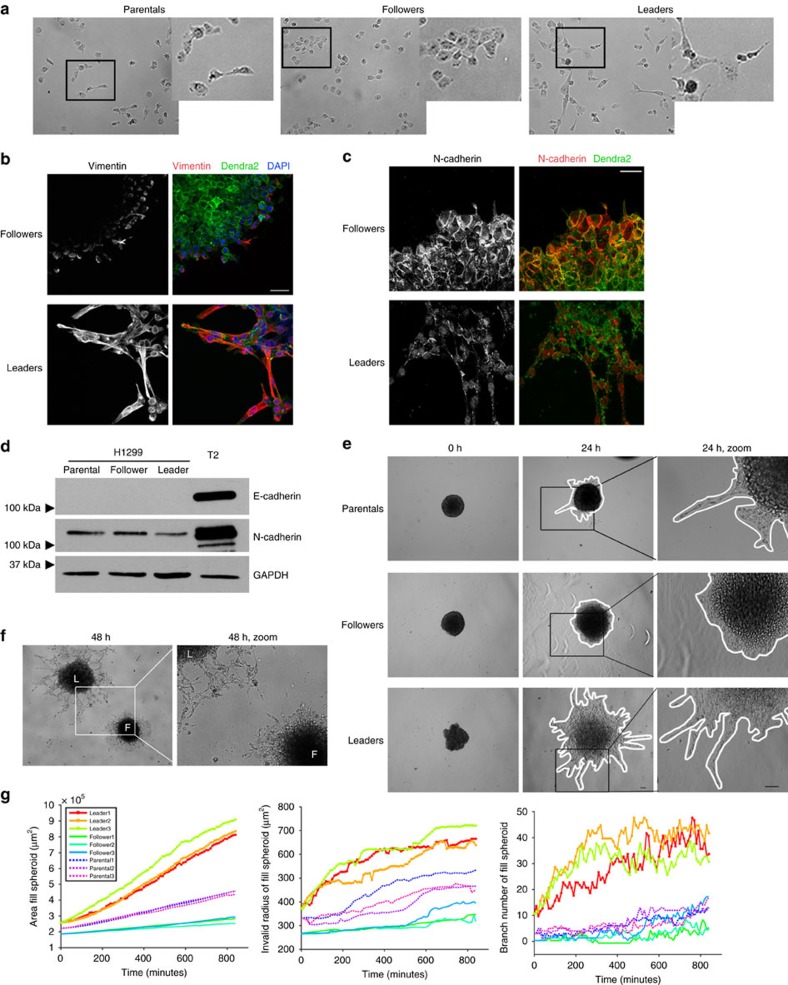
Figure 2. Leader cells maintain their invasive phenotype even while cultured as a purified population.
(a) Images of H1299 follower and leader purified cells compared to the parental line. Zoomed images are shown to the right. (b) Immunofluorescence staining of vimentin (red) in follower and leader purified spheroids. Scale bar, 50 μm. (c) Immunofluorescence imaging of N-cadherin in purified leader and follower spheroids. Scale bar, 50 μm. (d) Western blot of H1299 parental, follower and leader cells for E-cadherin and N-cadherin. The T2 mouse tumor-derived cells are a positive control for E-cadherin. GAPDH as a loading control. (e) Spheroid invasion assays comparing H1299 parental, follower and leader spheroids. Zoomed images are on the right. Scale bar, 50 μm. (f) Leader (L) and follower (F) spheroids were embedded in proximity to each other in the same matrix. Images were taken at 48 h post embedding, with a zoomed image to the right. (g) H1299 parental, follower and leader spheroids were imaged using live cell confocal microscopy. Fluorescence images in both time and z were analysed for area, invasive radius and branch number. Three spheroids were analysed per condition.

