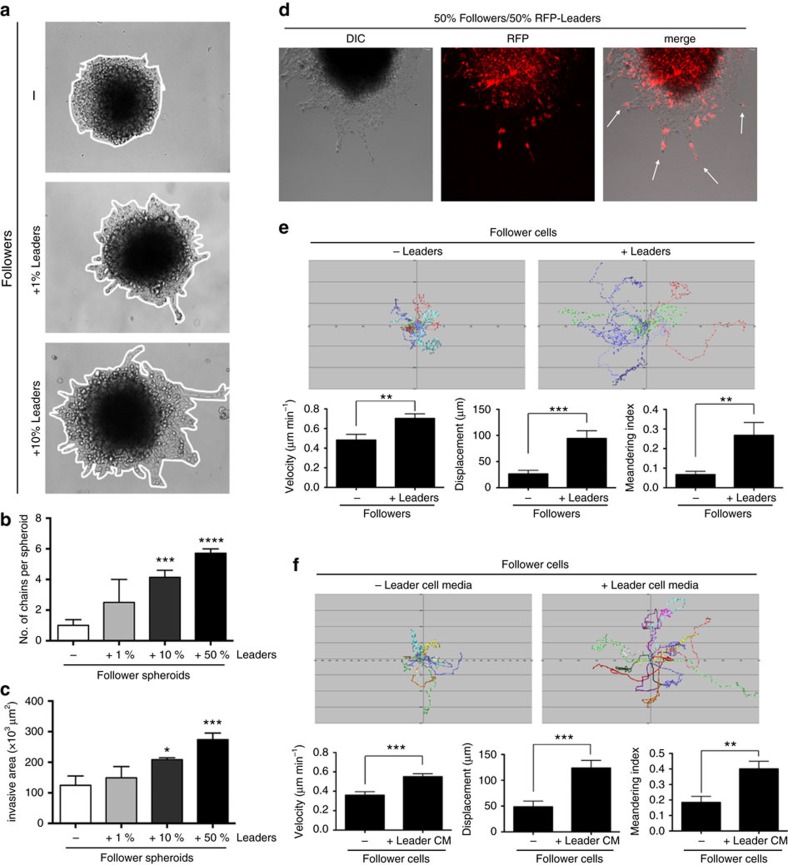
Figure 3. Leader cells promote motility and invasion of follower cells through a soluble factor.
(a) Spheroids were formed from follower cells either alone (−) or in combination with increasing amounts of leader cells. (b) Quantification of the number of chains per spheroid in the experiment from a. n=6–7 spheroids. ***P<0.001, ****P<0.0001, using an ordinary one-way ANOVA with a Tukey's multiple comparisons test. (c) Quantification of invasive area from the experiment in a. *P<0.05, ***P<0.001. (d) Spheroid invasion assay with RFP-expressing leader cells mixed with follower cells at a 50:50 ratio in a spheroid invasion assay. RFP-leader-positive chains are denoted by white arrows. (e) Follower cells were plated in 2D either alone or in co-culture with RFP-leader cells. Single follower cells were tracked over time. Cell track plots as well as quantification of these tracks are shown. n=10–13 cells. **P<0.01, ***P<0.001, using a Student's t-test. (f) Follower cells were plated in 2D in either their own or in LCM. Follower cell tracks are plotted and quantified below. n=15–17 cells. **P<0.01, ***P<0.001 using a Student's t-test. Error bars denote the s.e.m.

