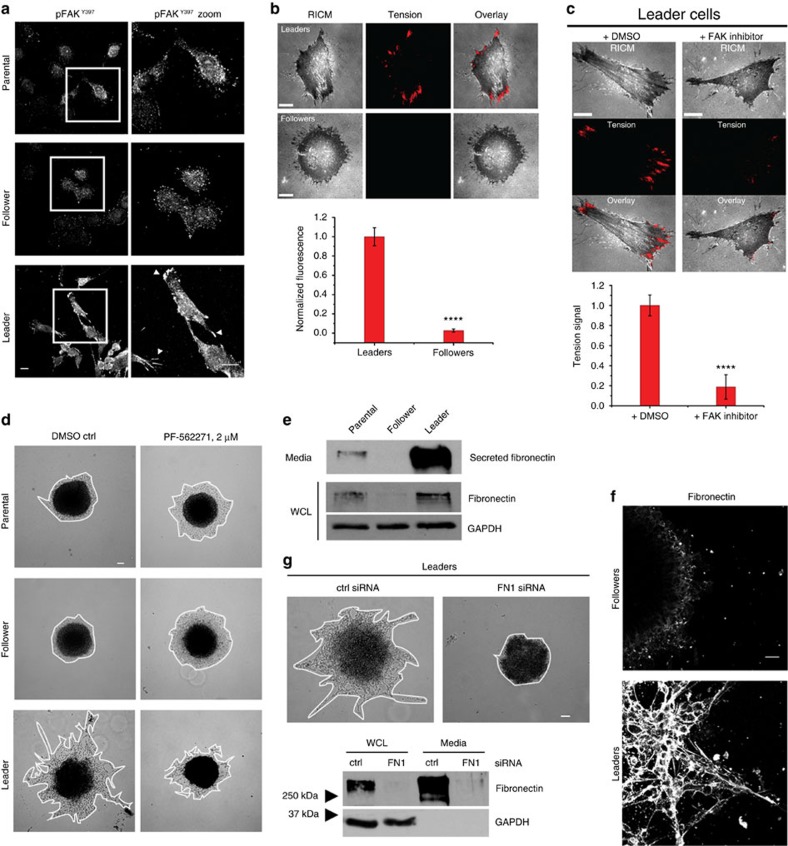
Figure 5. The fibronectin/FAK pathway drives leader cell invasion.
(a) Immunofluorescence imaging of pFAKY397 in H1299 parental, follower and leader cells plated in 2D. Arrowheads denote large adhesion sites in leader cells. Scale bar, 20 μm. (b) Representative reflection interference contrast microscopy (RICM) and integrin tension images of leader and follower cells32. An overlay of the RICM and integrin tension channels demonstrates that regions at the cell edge associated with FAs generate sufficient tension to unfold the titin-based probe for the leader cells. Plot below shows the average integrin tension signal for leaders and followers. Error bars represent the s.e.m. from 10 cells for each group collected from three chambers, ****P<0.0001 using a Student's t-test. Scale bars, 10 μm. (c) Representative RICM and integrin tension images for leader cells incubated in the presence of either 0.1% DMSO control and PF-562271 FAK inhibitor. Error bars represent the s.e.m. from 10 cells for each group collected from three chambers, ****P<0.0001 using a Student's t-test. Scale bars, 10 μm. (d) Spheroid invasion assay with H1299 parental, follower or leader cells in the presence of 2 μM PF-562271 FAK inhibitor or DMSO control. Scale bar, 100 μm. (e) Western blot of fibronectin protein in the media or WCL of H1299 parental, follower and leader cells. GAPDH was a loading control. (f) Immunofluorescence of extracellular fibronectin in follower and leader spheroids. Scale bar, 50 μm. (g) Fibronectin (FN1) was knocked down in leader cells using targeted siRNA. Scrambled siRNA was used as a negative control. Spheroids from FN1 siRNA-treated leader cells were assayed for invasion compared to control. Western blot below confirms knockdown efficiency. Scale bar, 100 μm.

