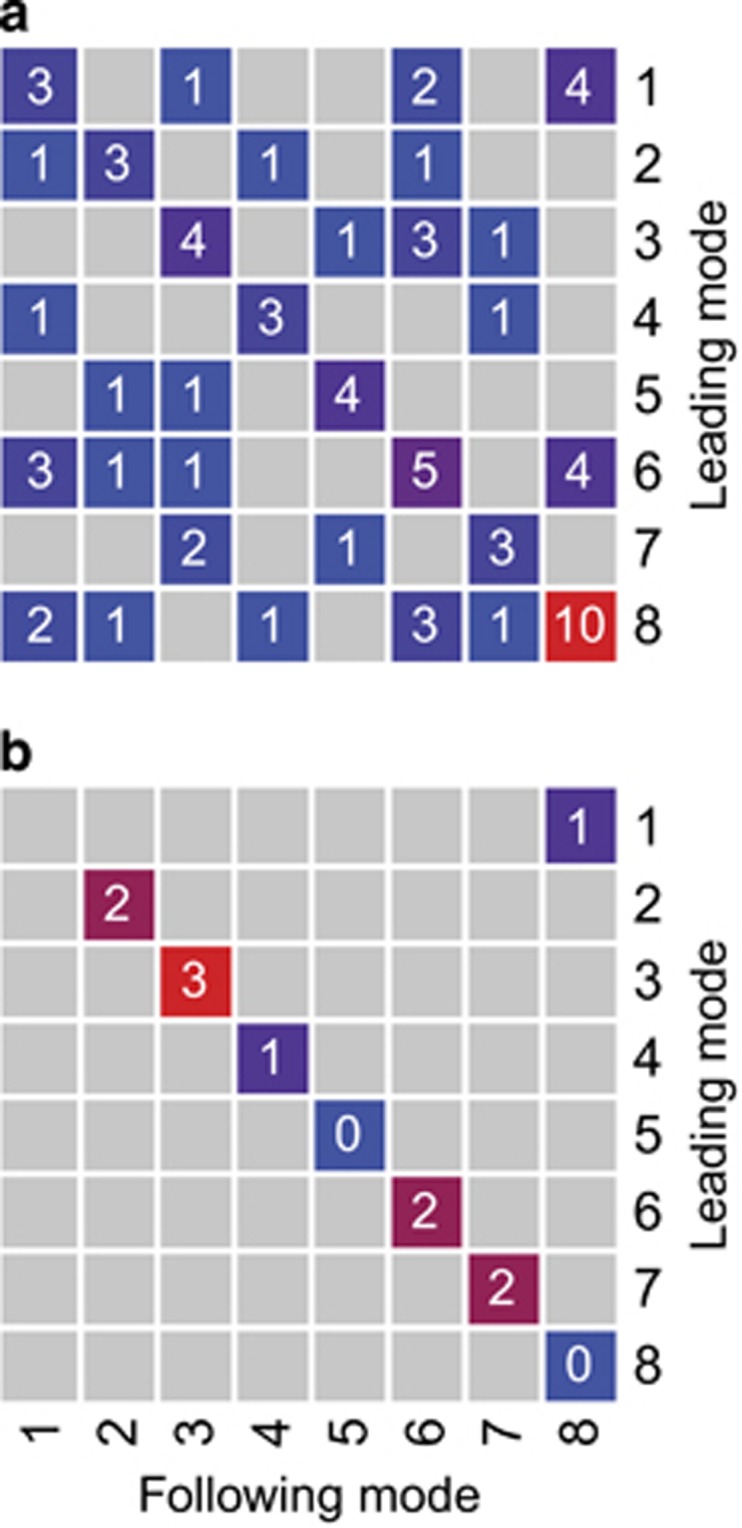
Figure 6.

Mode persistence and succession. (a) The number of occurrences of each possible transition. Gray squares without a number indicate that the transition was not observed. Squares are colored according to the value noted inside each square. (b) Statistically significant transitions. The value inside each square gives the number of times the number of transitions given in Figure 6a was exceeded in 100 random rearrangements of the modes. Only values below five are shown, squares are colored according to value. A full color version of this figure is available at the ISME journal online.
