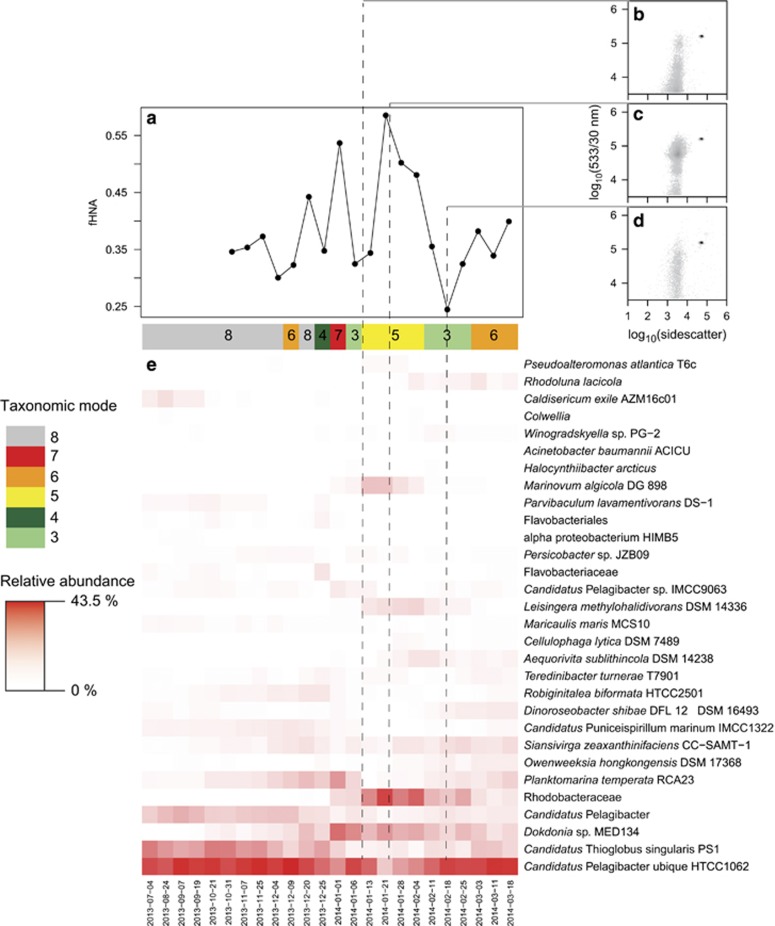
Figure 7.
Bacterial community dynamics during the 2013–2014 spring–summer season. (a) The fraction of cells belonging to the high nucleic acid population (fHNA). (b) Flow-cytogram of green fluorescence (533 nm) and sidescatter for 10 January 2014. (c) Flow-cytogram of green fluorescence (533 nm) and sidescatter for 23 January 2014. (d) Flow-cytogram of green fluorescence (533 nm) and sidescatter for 18 February 2014. (e) Relative abundance of the 30 most abundant closest completed genomes (CCGs) and closest estimated genomes (CEGs). The mode assigned to each sample is given by the color bar at the top of the heatmap. A full color version of this figure is available at the ISME journal online.

