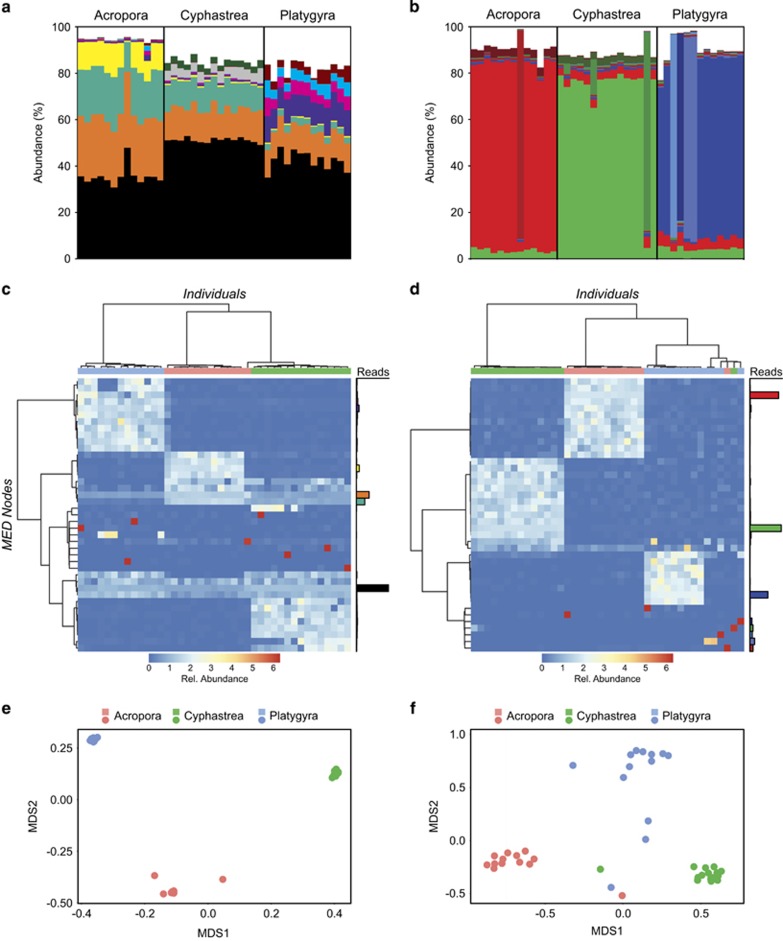
Figure 1.
Symbiodinium ITS2 and psbAncr MED nodes associated with Acropora downingi, Cyphastrea microphthalma and Platygyra daedalea. (a, b) Relative composition of the 10 most abundant ITS2 (a) and psbAncr (b) MED nodes. Each colour represents a distinct MED node. See Supplementary Information for further details of ITS2 and psbAncr MED nodes. (c, d) Heat maps showing the relative proportion of MED nodes across individuals. Individuals and MED nodes are clustered based on Bray-Curtis similarity. Coloured bars indicate Acropora downingi (red), Cyphastrea microphthalma (green) and Platygyra daedalea (blue) individuals. Relative abundance of reads incorporated into each node are shown to the right of each heat map. (e, f) Bray Curtis NMDS plots for ITS2 (e) and psbAncr (f).

