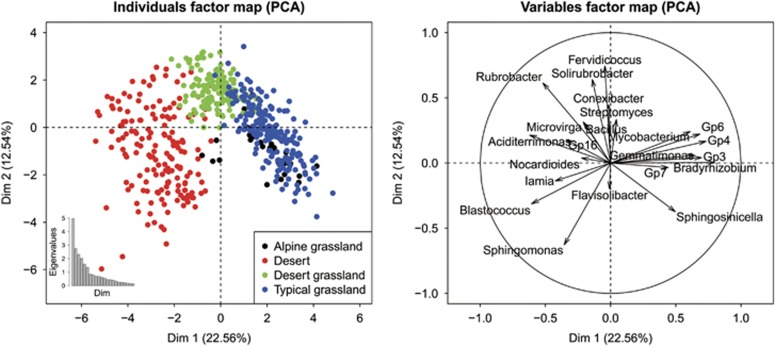
Figure 2.
Variables and individuals graph in principal component analysis using PCA function in FactoMineR package. We used taxonomic abundances data (OTUs defined at 97% sequence similarity) from 24 bacterial dominant genera (average abundance >50 across all soil samples) as quantitative variables, which were used to perform the PCA. Individuals were colored from the categorical variables, habitat types: black, red, green and blue plots represent samples from alpine grassland, desert, desert grassland and typical grassland, respectively. The percentage of variability explained by two dimensions was given: 22.56% for the first axis and 12.54% for the second axis. PCA, principal component analysis.

