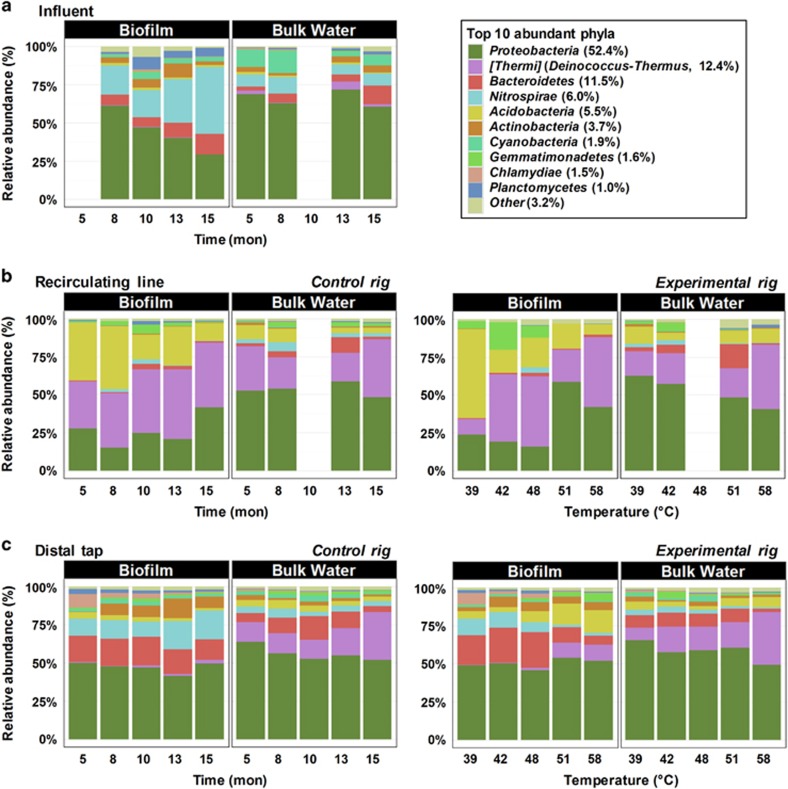
Figure 1.
Taxonomic profiles of sample groups at the phylum level: (a) influent, (b) recirculating line, (c) distal tap. Time is in month (mon) and temperature indicates water heater temperature setting. Top abundant phyla were defined as those that were >1% of total sequences across all samples combined (percentage shown in brackets); the remainder were combined and lumped in a category designated as ‘Other'. The three blank columns correspond to lost samples.

