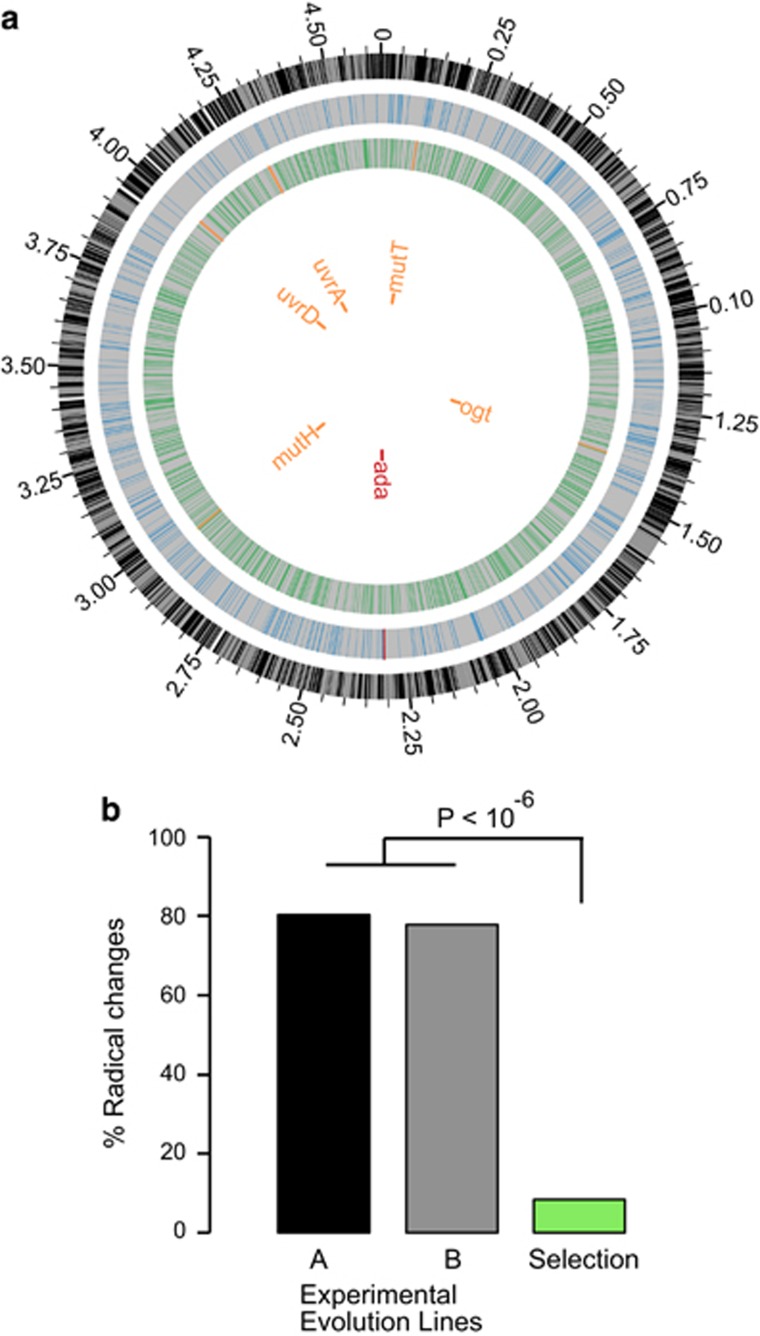
Figure 6.
Experimental evolution of Escherichia coli reveals the contribution of the selection–drift balance to the evolution of endosymbiotic genes. (a) Distribution of mutations of lines A and B at the end of the evolution experiment. The outermost circle refers to the genome of E. coli K12 MG1655, used as reference for mapping the mutations in the evolution experiment. The blue circle refers to line A, whereas the green circle represents line B. Genes are indicated with vertical lines to each of the circles. Mutated repair genes for line A (red) and line B (orange) are indicated. (b) Proportion of radical mutations during the evolution experiment of E. coli under strong genetic drift (black and grey columns) and mild genetic drift (green column). Roughly 80% of the mutations in lines A and B were radical amino-acid changes, such that the original amino acid underwent a replacement to an amino acid with different charge, polarity or volume and polarity. The population under milder drift exhibited a significantly lower proportion of its amino-acid replacements being radical (about 8%).

