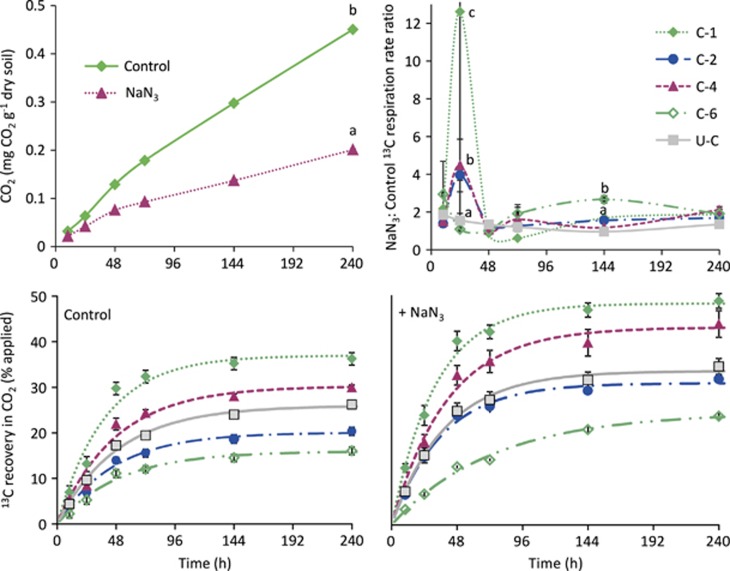
Figure 1.
Cumulative CO2 (mean±s.e.) from 13C uniformly labeled glucose respired during 10 days in control and NaN3-treated soils (top left), +NaN3:Control 13C (mean±s.e.) respiration rate ratio from individual glucose position (top right) and cumulative 13C (mean±s.e.) recovered in CO2 released from position-specific 13C-labeled glucose applied to soil with control (bottom left) and azide-exposed (bottom right). 13C curves were fitted with nonlinear least-square regressions according to an exponential equation (cum13C(t)=13Cmax*(1−e−kt)), where cum 13C (t) is the cumulative 13C amount depending on time, 13Cmax is the parametrically determined maximum of 13C, k is the mineralization rate and t is time (parameter estimates in Supplementary Table S4). Steven' runs test for the fitted 13C curves revealed no deviation from linearity (Supplementary Table S5). Significant differences between fitted curves are displayed in Supplementary Table S6.

