Figure 3.
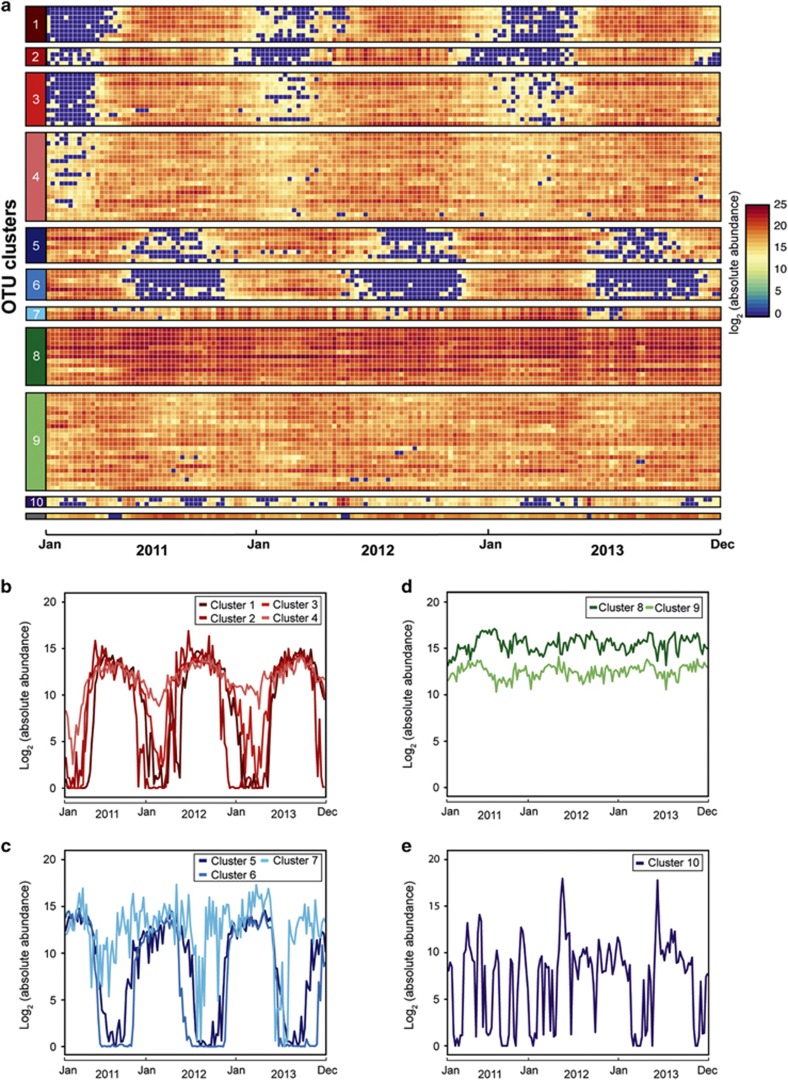
Seasonal patterns for the 100 most abundant OTUs over the 3-year PICO time series. (a) The heat map depicts the log2 (absolute abundance; cells ml−1) for each OTU, obtained by taking rRNA operon corrected relative library abundance and total prokaryotic cell counts to calculate a ‘cell count' for each OTU. OTUs are ordered based on patterns observed in soft clustering, shown as numbered boxes on the left side of the figure. The unnumbered gray OTU was not assigned to a cluster. (b–e) Show the centroids of the 10 soft clusters identified for the 100 most abundant OTUs over the entire PICO time series. Plots show the temporal dynamics of clusters that were visually assigned to (b) summer-associated, (c) winter-associated, (d) ubiquitous and (e) episodic groups.

