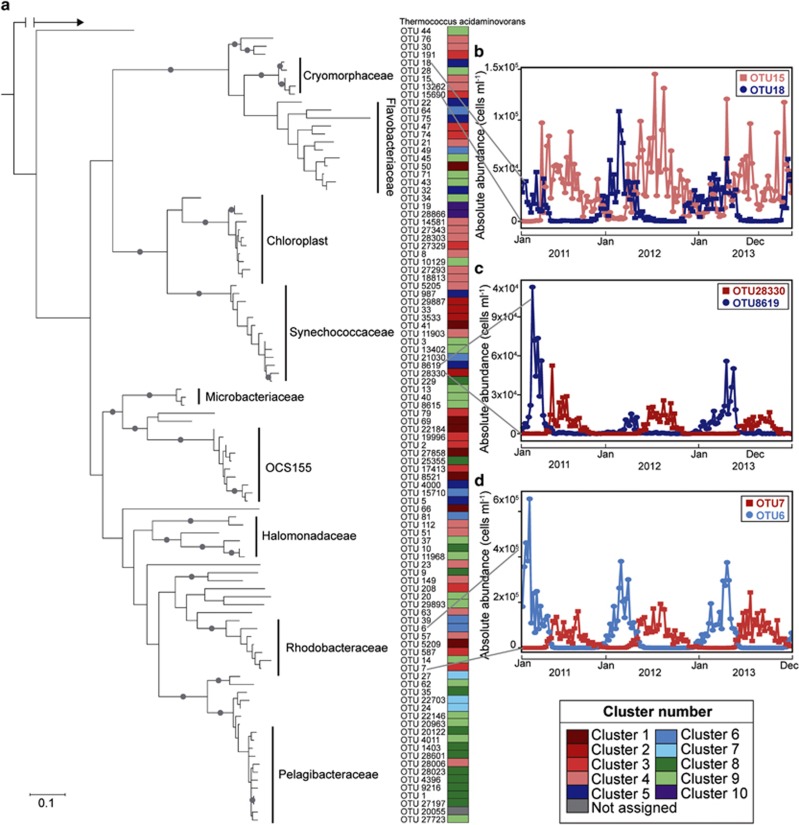
Figure 4.
Seasonal patterns of closely related taxa. (a) Partial 16S rRNA gene maximum-likelihood phylogenetic tree showing the 100 most abundant OTUs from the weekly PICO time series rooted with Thermococcus acidaminovorans. Bootstrap values greater than 80% are indicated by a gray circle at the node. Colored boxes on the right show the assigned clusters (from Figure 3). Larger clades are also labeled with the family assigned by RDP Classifier. (b) Absolute abundances of two OTUs within the genus Phaeocystidibacter (OTUs 15 and 18) in the family Cryomorphaceae over three years of weekly 16S rRNA gene libraries at the PICO time series. (c) Absolute abundances of two OTUs within the genus Synechococcus (OTUs 8619 and 28830). (d) Absolute abundances of two OTUs within the family Rhodobacteraceae, one identified as the dominant OTU within the genus Octadecabacter (OTU 6) and the other a Phaeobacter-like genus (OTU 7).

