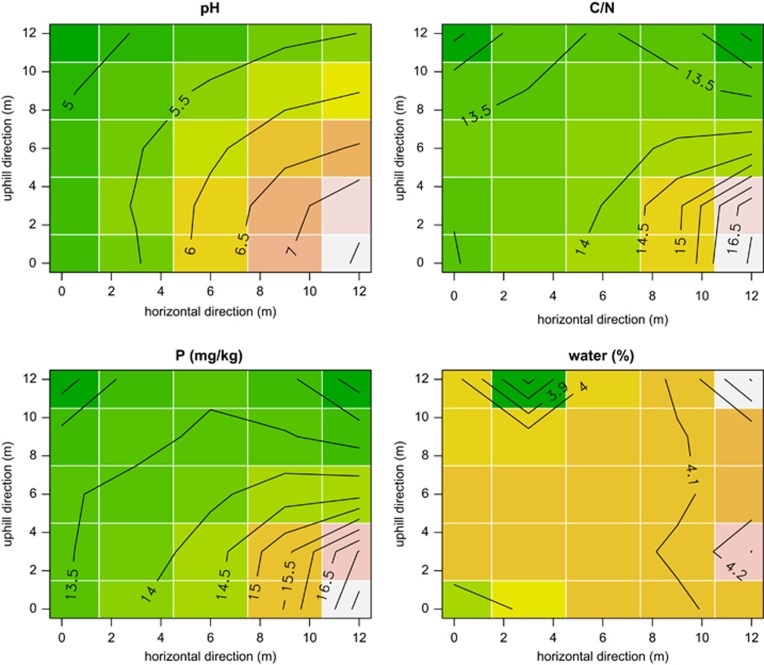
Figure 2.
Kriging interpolation of four of the measured environmental variables as measured in one of the three macroplots (macroplot 1, see Supplementary Information). Plots were by construction aligned along a soil textural gradient on the slopes of a hillside (Supplementary Figure S1), with the gradient running along the uphill–downhill axis (y axis; Supplementary Figures S2 and S3). As we expected, the main gradient in major soil variables followed the uphill–downhill axis, although in the case of macroplot 1 water showed a patchy distribution.

