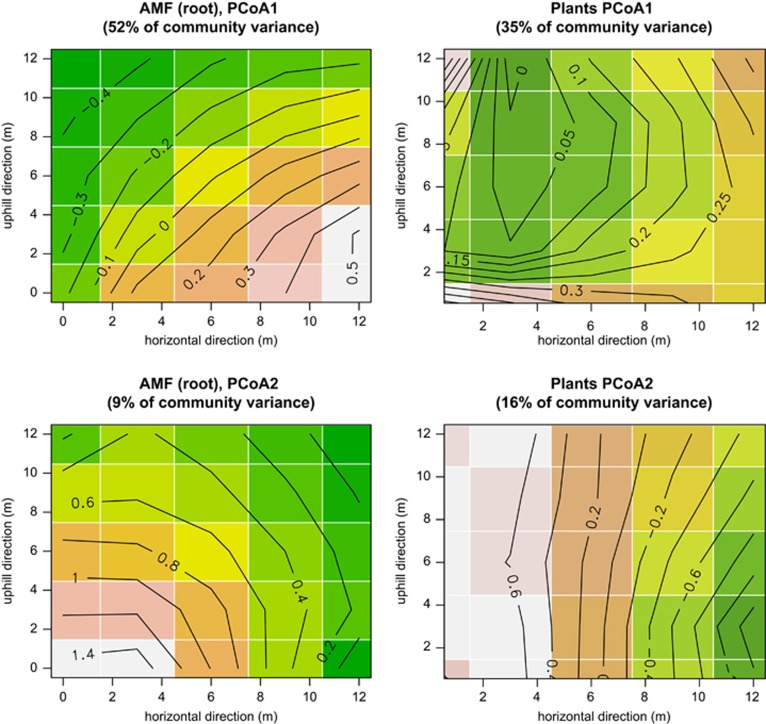
Figure 3.
Kriging interpolation of the first two PCoA (see also Figure 4) axes of AMF and plants. Data are shown for macroplot 1, and are thus directly comparable with environmental variables presented in Figure 2. Spatial patterns in the structure of the two assemblages appear to be only poorly correlated. Similar patterns were observed in the other macroplots (not shown).

