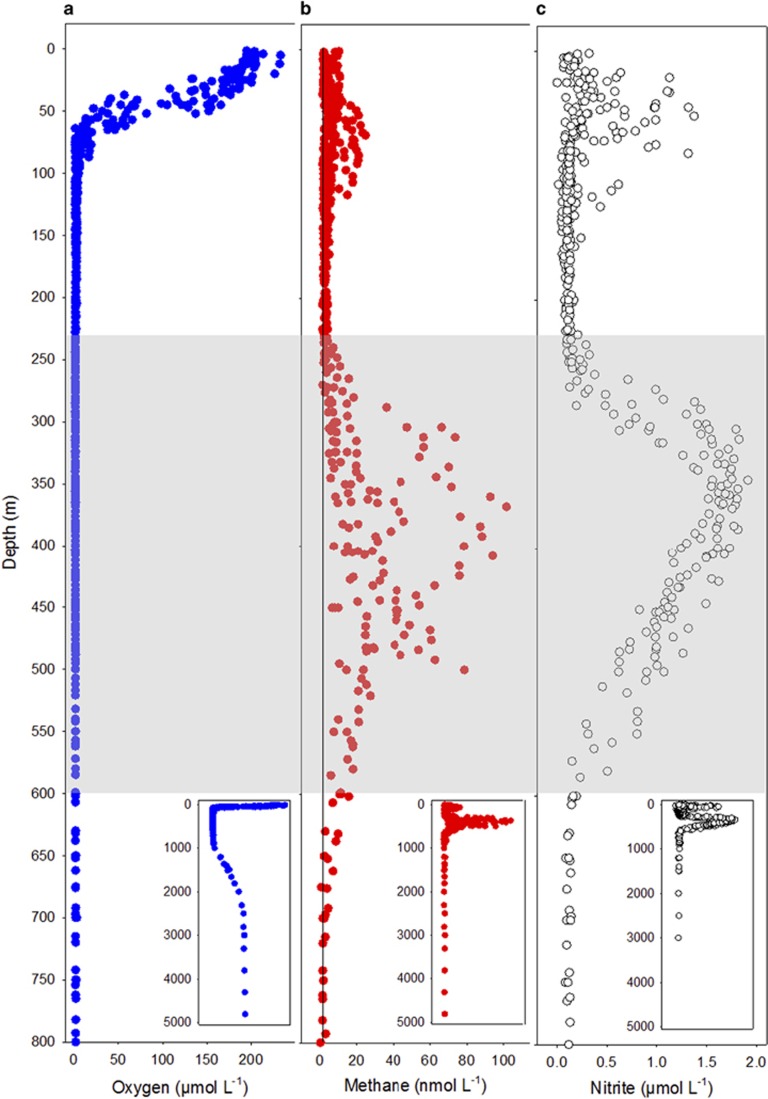
Figure 1.
Water column profiles of (a) oxygen, (b) methane and (c) nitrite were constructed from conductivity–temperature–depth (CTD) deployments with the top 800 m shown in main panels and all data (0–5000 m) shown in inset plots. The shaded grey segment indicates the core of the OMZ (230–600 m) where oxygen is below LOD (~1.4 μmol l−1) and methane and nitrite are accumulating. Black line indicates atmospheric equilibration of methane at the depth-specific temperature and salinity.

