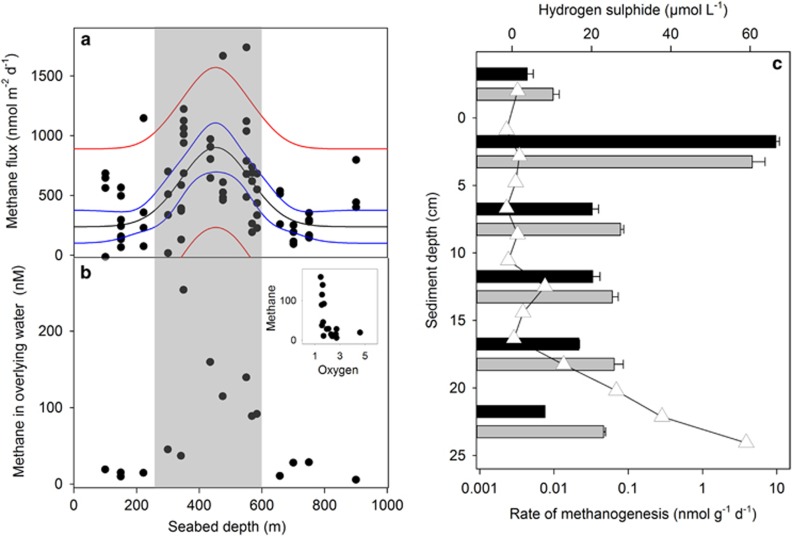
Figure 2.
Spatial variation in (a) methane flux from sediment mini-cores and (b) methane concentration in the bottom, water measured above the cores (<15 cm from sediment surface), plotted against seabed depth. The shaded area indicates where the conductivity–temperature–depth (CTD) profiles measured anoxic bottom water (~10 m from seabed). The Gaussian peak, 4-paramter regression line (black), 95% confidence (blue) and prediction (red) intervals are shown in a. Inset, oxygen concentration and methane concentration in the bottom water for the points shown in b. (c) Depth profiles of methanogenic potential (displayed on a logarithmic scale) measured in slurries at five discrete sediment layers from 0 to 25 cm in cores from 550 m (grey) and 650 m (black). As a result of this strong depth decay, all further experiments focused on the top 5 cm only. Hydrogen sulphide profile for a core from 550 m (650 m data unavailable) overlain in unfilled triangles.

