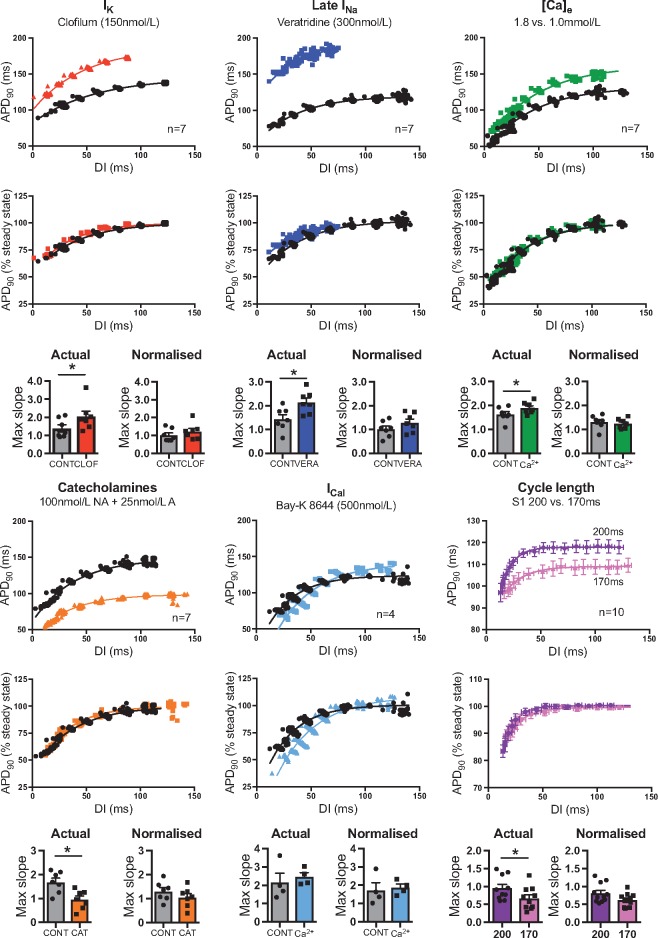
Figure 2.
Influence of action potential duration on the kinetics of the dynamic restitution curve. Effect of electrical pacing and pharmacological interventions on the relationship between ventricular mono-phasic action potential duration (APD90) and diastolic interval (DI) in isolated guinea pig hearts. Top panel—actual values. Middle panel—normalized as a percentage of steady-state APD90. Bottom panel—mean values of maximum restitution slope for actual and normalized restitution curves. Representative curves for each experimental condition vs. control. Maximum slopes represent mean ± SEM from four to seven experiments, as noted. NA = noradrenaline. A = adrenaline. Different from control; *P < 0.05. Paired Student’s t-tests.

