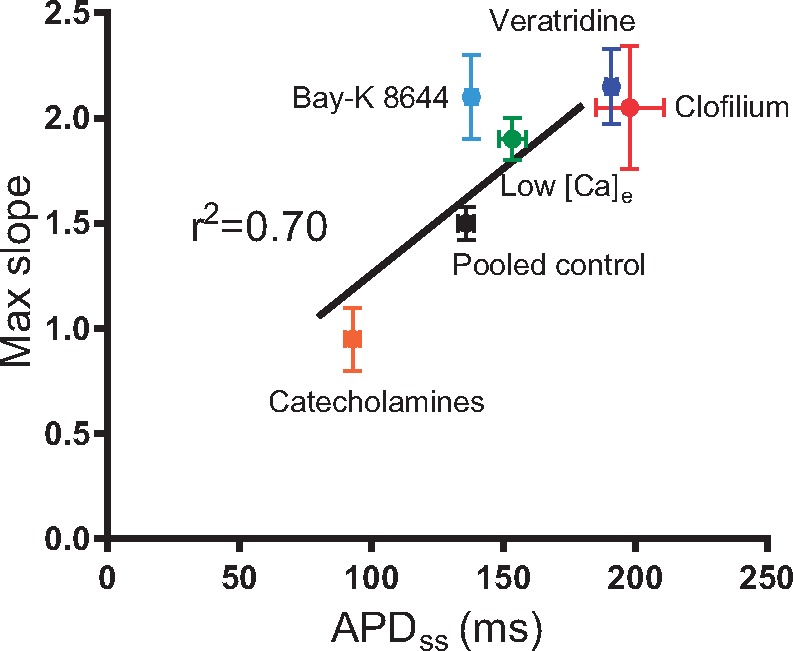
Figure 3.

Correlation between baseline (steady-state) action potential duration and maximum slope of the dynamic restitution curve in isolated guinea pig hearts. APDss=action potential duration at steady state. [Ca]e=extracellular calcium concentration. (n = 7, with the exception of Bay-K 8644 where n = 4) Note; Bay-K 8644 was no different from its relative control values.
