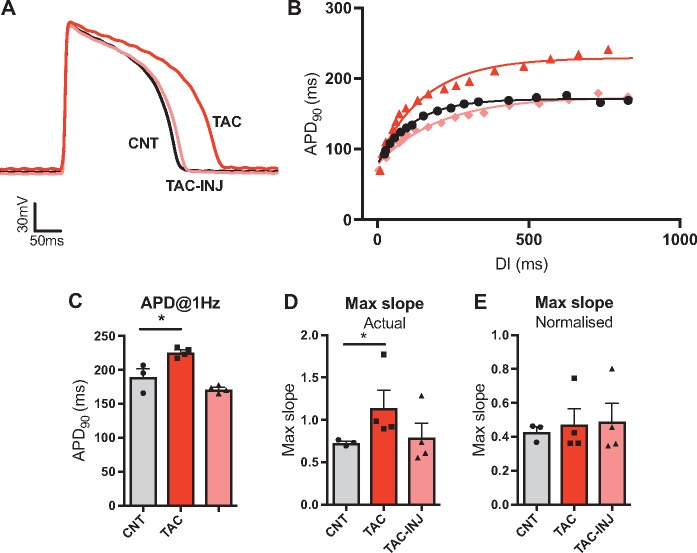
Figure 5.
Transverse aortic constriction-induced action potential prolongation. (A) Representative action potential recordings (@1Hz) in isolated ventricular myocytes from animals 150-day post-transverse aortic constriction (TAC), in sham operated-controls and TAC myocytes with negative current injection (TAC-INJ) to normalize action potential duration (APD90). (B) Representative dynamic restitution curves from sham, TAC and TAC-INJ myocytes. (C–E) Mean data on the influence of TAC and TAC-INJ on APD90 (C), the maximum slope of the restitution curve (D) and maximum slope of the normalized restitution curve (E). Data represent mean ± SEM. Different from control; *P < 0.05. Nested general linear model ANOVA with Tukey’s post hoc tests. (sham n = 3 hearts with five to eight cells per heart, TAC n= 4 hearts with three to eight cells per heart, TAC-INJ n = 4 hearts with three to five cells per heart)

