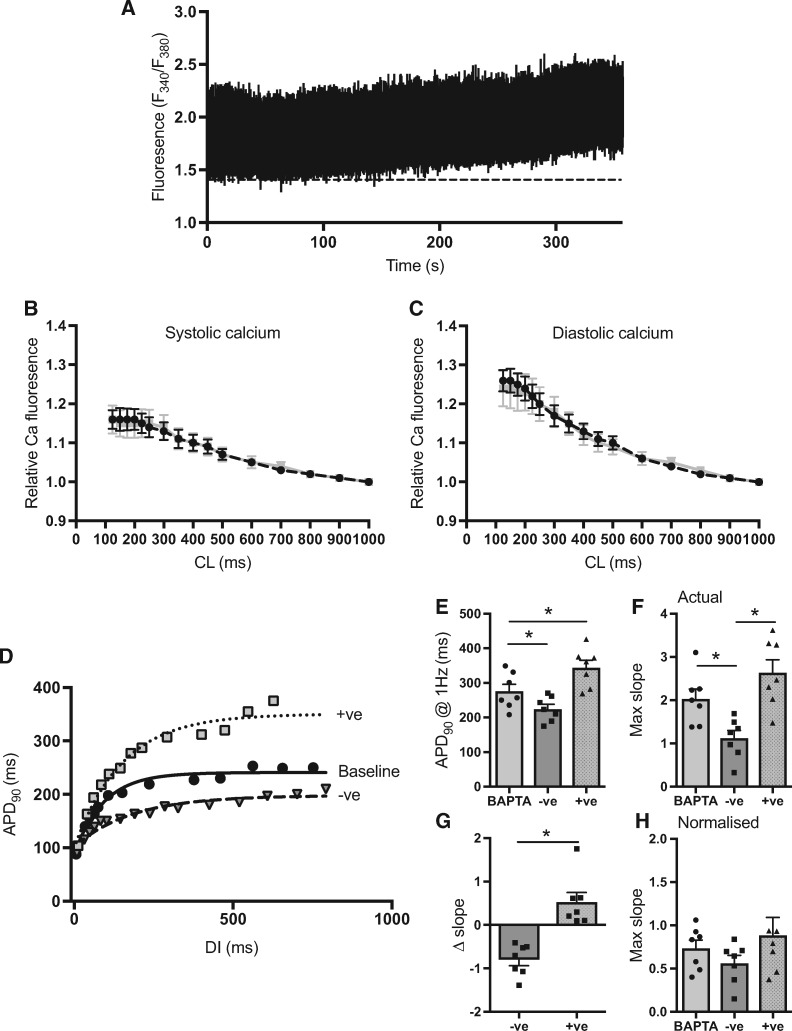
Figure 6.
Role of intracellular calcium handling. (A) Representative trace demonstrating changes in calcium-dependent ratiometric Fura-2-AM fluorescence with decreasing pacing cycle length (CL). (B and C) Mean data on the relative changes in systolic and diastolic calcium fluorescence with pacing under control conditions (black) and in cells treated with clofilium (150 nmol/L, grey). (n = 6 hearts, 4–5 cells per heart—per condition). (D) Representative dynamic restitution curves from ventricular myocytes treated with the calcium chelator BAPTA-AM (100 μmol/L). Action potential duration (APD) was modified by direct current injection in perforated patch. (E, F, G and H) Mean data on the effects of outward (−ve) and inward (+ve) current injection on steady-state APD, maximum restitution slope, change in slope and steady-state APD normalised maximum slope, in BAPTA treated ventricular myocytes. Data represent mean ± SEM. Different from BAPTA; *P < 0.05. Nested general linear model ANOVA with Tukey’s post hoc tests or paired Student’s t-test. (n = 7 hearts, 1–3 cells per heart)

