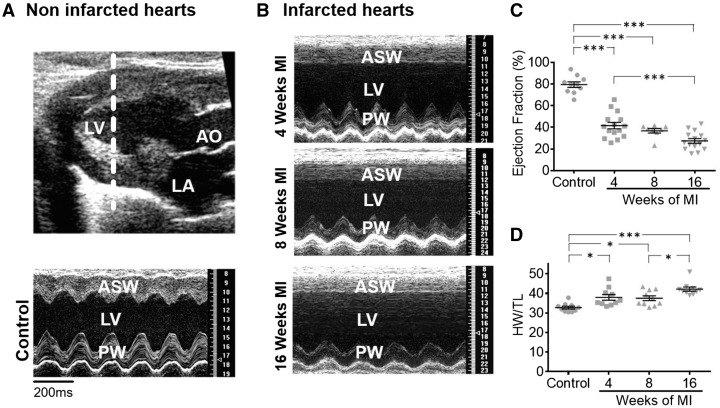
Figure 1.
Rat heart size increases while heart function declines progressively post-MI (A) Echocardiography data; Top panel: Echocardiography image indicating the plane (white punctuated line) in the LV from which echocardiography data represented in the bottom panel was collected, over time. LA marks the location of the left atrium and AO marks the aorta. Bottom panel: echocardiography data showing the ASW and the PW function of the LV. (B) Echocardiography data at different time points post-MI; (C) Ejection fraction at different time points post-MI, sample numbers in control followed by chronological order of MI samples: n = 10, n = 15, n = 8, n = 15; (D) Heart weight corrected to TL at different time points post-MI, each time point n = 10; Control rats were from an even spread of time points 4 at 4-week, 4 at 8-week, and 3 at 16-week post-MI; N, number of animals, **P < 0.001, ***P < 0.0001 as determined with one-way ANOVA followed by Bonferroni post hoc correction.

