Figure 6.

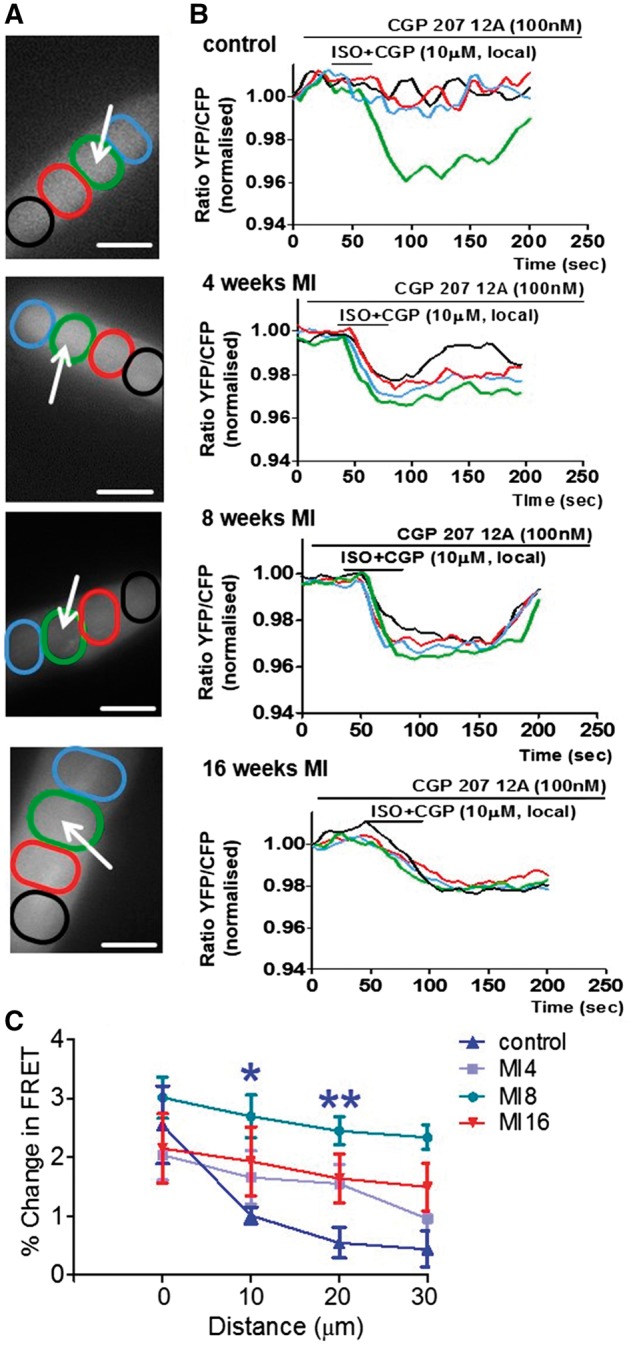
The β2AR-dependent cAMP response, which is confined in control cells diffuses throughout the whole cytosol at different time points post-MI. (A) images of cardiomyocytes indicate areas of interest (coloured ovals) situated at various distances from the point of stimulation (white arrows) where FRET was measured after local selective stimulation of β2ARs in T-Tubules; Scale bars in, 20 µM (B) colour-coded curves of FRET response corresponding to the four areas of interest as indicated on the right panels.(C) Differences of the relative β2AR-cAMP levels at progressive distances from the point of original agonist application in comparison to control cardiomyocytes, N = 5/n = 1 each; N, number of animals; n, number of cells. ‘*’ indicates a significant difference in cAMP signal level from control, *P < 0.05 as determined by one-way ANOVA followed by Bonferroni post hoc correction.
