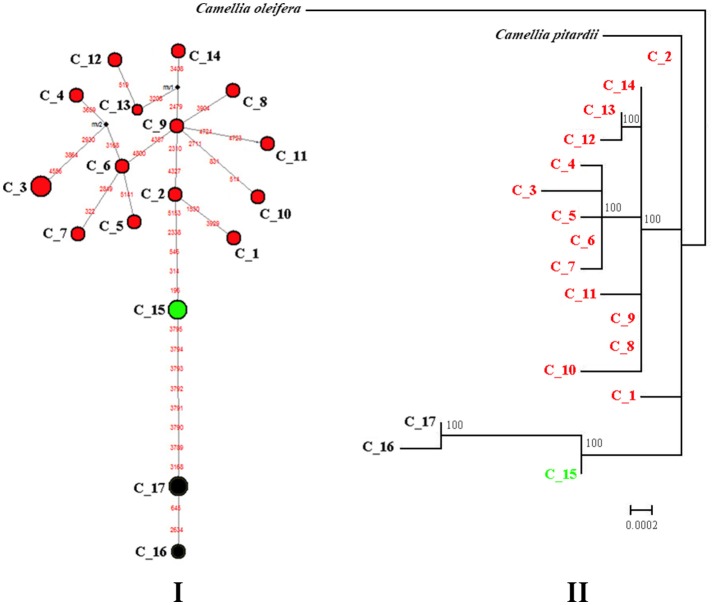
Figure 2.
Median-joining network (I) and Maximum Likelihood phylogenetic tree (II) showing the genetic relationships among the observed cpDNA haplotypes of C. flavida. (I) Median-joining network of 17 cpDNA haplotypes resolved in C. flavida. Each haplotype is designated by a number C_1 to C_17 (see Table S1). Colors denote the groups as identified by SAMOVA analyses of cpDNA marker. Circle size is proportional to haplotype frequency. Missing haplotypes are represented by black dots, and mutations are shown in red. (II) Maximum Likelihood tree. Numbers at nodes represent the result of the ML bootstrap analysis. Nodes without numbers correspond to supports weaker than 70% BP.

