. 2017 Feb 14;8(5):3628–3634. doi: 10.1039/c6sc03720h

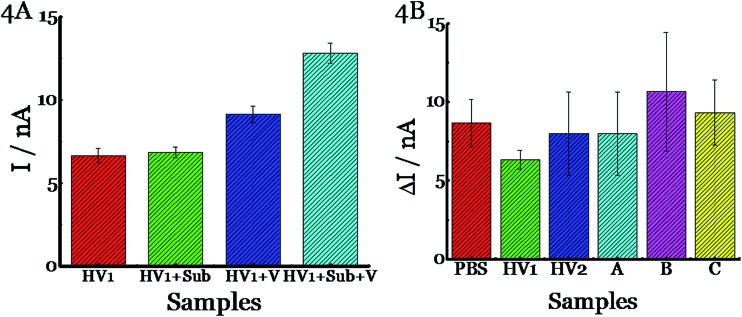
Fig. 4. Detection of spiked H1N1 influenza virus (A/Brisbane/59/2007, 2.5 × 10⁵ pfu per sample) in human samples using (4,7di-OMe)Sα2,3Gal. (A) A nasal swab from human volunteer 1 was incubated with PBS only (HV1), substrate (HV1+Sub), virus (HV1+V), or substrate + virus (HV1+Sub+V) at 37 °C for 15 min. The y axis, I, represents the current. (B) (4,7di-OMe)Sα2,3Gal was incubated with different matrices such as PBS, HV1, HV2, A, B, or C at 37 °C for 15 min. PBS is buffer, and HV1 and HV2 are nasal swabs from human volunteers. A, B and C are samples from patients who did not have influenza as determined by rRT-PCR. The current was measured using Accu-Chek Aviva strips (Roche Diagnostics) with the 10 s average current recorded 5 s following substrate introduction at a working potential of –0.15 V. The y axis, ΔI, represents the difference in current before and after the addition of the substrate. All experiments were performed in triplicate independently on different days to demonstrate scientific rigor.

Fig. 4