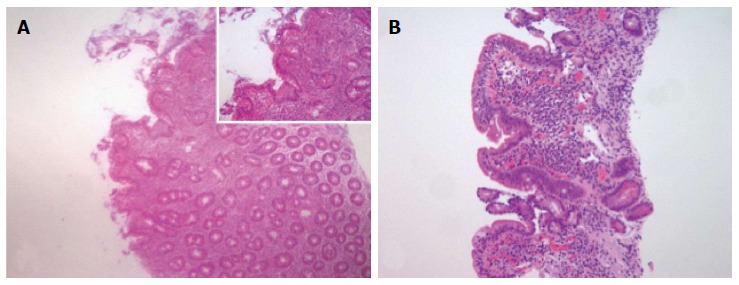
Figure 2.

Histological features of celiac disease. A: Example of tissue scored as Marsh 2 characterized by lymphocytic enteritis with crypt hyperplasia: Intraepithelial lymphocytosis and elongation and branching of crypts in which there is an increased proliferation of epithelial cells; B: Example of tissue scored as Marsh 3A characterized by partial villous atrophy, the villi are blunt and shortened. Arbitrarily, samples are classified as partial villous atrophy if the villus-crypt ratio was less than 1:1 (Objective magnification × 4, inset × 10).
