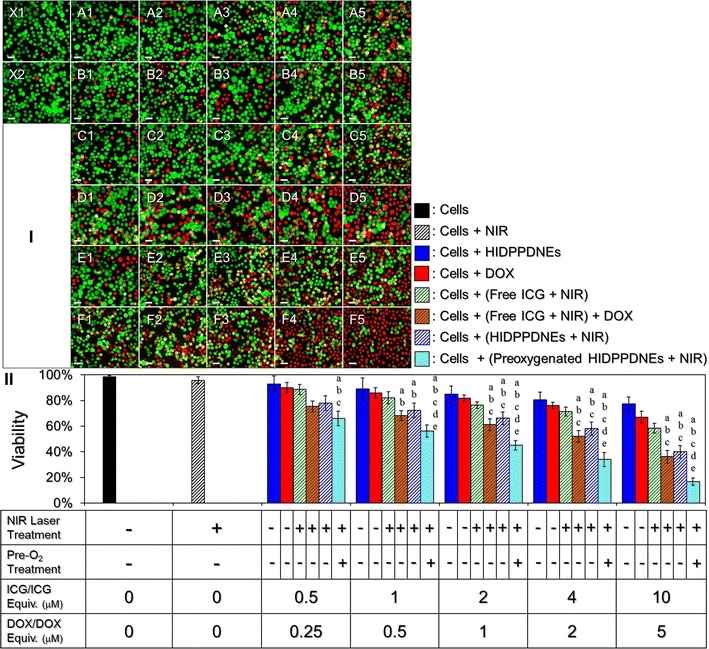
Fig. 11.

Cytotoxicity of the HIDPPDNEs to HER2(+) breast cancer cells in vitro. I Photomicrographic images of MDA-MB-453 cells under various treatments. Rows A and B represent the groups that cells were co-cultured with the HIDPPDNEs (A) or free DOX (B) for continuous 24 h in which the concentrations of DOX were set at 0.25 (A1 and B1), 0.5 (A2 and B2), 1 (A3 and B3), 2 (A4 and B4), and 5 (A5 and B5) μM. Rows C and D represent the groups that cells were pre-co-cultured with 0.5 (C1 and D1), 1 (C2 and D2), 2 (C3 and D3), 4 (C4 and D4), and 10 (C5 and D5) μM of free ICG for 4 h, then treated with NIR irradiation for 5 min followed by incubation at 37 °C in the absence (Row C) or presence of 0.25- (D1), 0.5- (D2), 1- (D3), 2- (D4), and 5- (D5) μM DOX for 24 h. Rows E and F represent the groups that cells were pre-co-cultured with HIDPPDNEs (E) or preoxygenated HIDPPDNEs (F) for 4 h in which the concentrations of ICG and DOX contained (ICG/DOX) were set at 0.5/0.25 (E1 and F1), 1/0.5 (E2 and F2), 2/1 (E3 and F3), 4/2 (E4 and F4), and 10/5 (E5 and F5) μM, then treated with NIR irradiation for 5 min followed by incubation at 37 °C for 24 h. X1 denotes the cells with neither drug (ICG and/or DOX) nor NIR exposure. X2 represents the cells treated with NIR irradiation for 5 min followed by incubation at 37 °C for 24 h. The cells in row C, D, E, and F were washed twice with PBS before NIR exposure. The green and red cells stained by calcein-AM and PI represent live and dead cells, respectively. All images were photographed using a fluorescence microscope at ×200 magnification. Scale bar 30 μm. II Quantitative analyses of the viabilities of MDA-MB-453 cells after treatment with DOX, free ICG, or HIDPPDNEs in different conditions as indicated in the X-axis. Values are mean ± s.d. (n = 3). a P < 0.05 as compared to the HIDPPDNE-treated group without NIR exposure. b P < 0.05 as compared to the group with equal concentration of free DOX. c P < 0.05 as compared to the group with equal concentration of free ICG and NIR irradiation. d P < 0.05 as compared to the group with equal dose of free ICG and NIR irradiation followed by incubation with DOX. e P < 0.05 as compared to the group with equal dose of HIDPPDNEs and NIR irradiation
