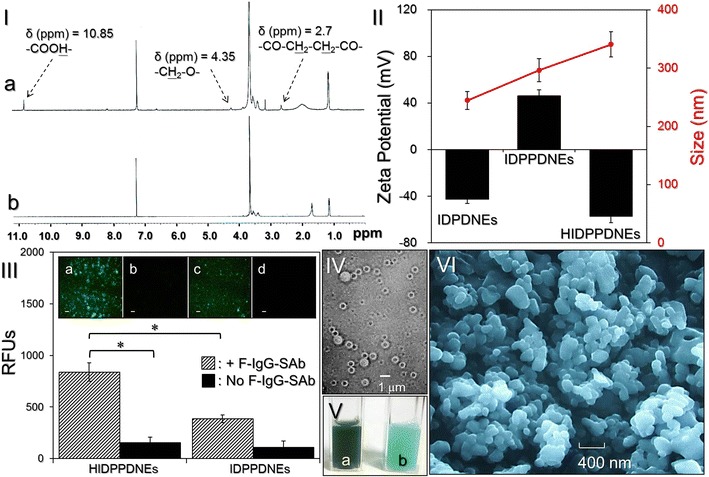
Fig. 2.

Assessment of physicochemical properties of the HIDPPDNEs. I The 1H NMR spectra of the synthetic CT-PF68 (a) and Pluronic F68 (b). II Size (red line) and surface charge (black bars) of the IDPDNEs, IDPPDNEs, and HIDPPDNEs. III Verification of the presence and bioactivity of anti-HER2-mAbs on the HIDPPDNE surface. The inset photographs are the representative fluoromicroscopic images of HIDPPDNEs (a, b) and IDPPDNEs (c, d) with (a, c) and without (b, d) F-IgG-SAb conjugation at ×200 magnification. Scale bar 10 μm. The intensity of fluorescence expressed from each group was measured using spectrofluorometry at 488/525 nm of excitation/emission wavelength and was quantitatively represented by RFUs. Values are mean ± s.d. (n = 3). *P < 0.05. IV Photomicrographic image of HIDPPDNEs before filtration at magnification of ×400. V Appearance of the HIDPPDNE (a) and ICG-loaded PEI-coated PFC double nanoemulsion (b) solutions. VI SEM image of the HIDPPDNEs at magnification of ×10,000
