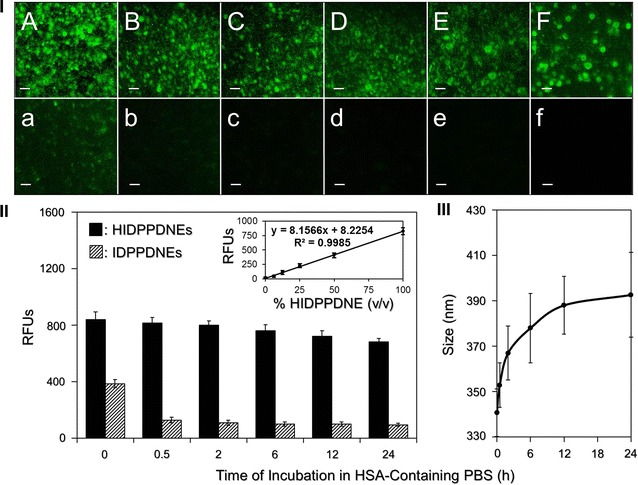
Fig. 3.

Assessment of stability of the HIDPPDNEs under protein-enriched environment. I Representative fluoromicroscopic images of F-IgG-SAb-bound HIDPPDNEs (A–F) and IDPPDNEs (a–f) which were pre-incubated in a 37 °C HSA buffer for 0 (A/a), 0.5 (B/b), 2 (C/c), 6 (D/d), 12 (E/e), and 24 (F/f) h prior to conjugation with the fluorescent probe. All images were photographed at ×200 magnification. Scale bar 10 μm. II Quantitative analyses of the fluorescence levels expressed from the HIDPPDNEs and IDPPDNEs after maintained in a 37 °C HSA buffer for different time. The intensities of the fluorescence were measured using spectrofluorometry at 488/525 nm of excitation/emission wavelength and were quantitatively represented by RFUs. The inset curve presents the correlation between the concentration of the HIDPPDNE (% v/v) and the RFUs expressed that was determined by using spectrofluorometry at 488/525 nm of excitation/emission wavelength. Values are mean ± s.d. (n = 3). III Quantitative analyses of the size variation of the HIDPPDNE after maintenance in a 37 °C HSA buffer for different time. Values are mean ± s.d. (n = 3)
