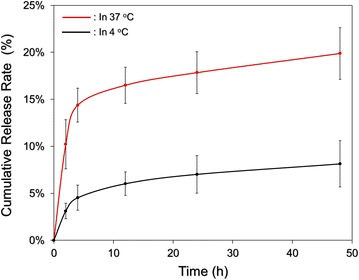
Fig. 6.

Kinetic release profiles of DOX from the HIDPPDNEs in vitro. The cumulative release curves of the HIDPPDNE-entrapped DOX under 4 and 37 °C in PBS were established by measuring the concentrations of DOX in the supernatant through UV–Vis spectrometry (λ = 485 nm) after treatment for 0, 2, 4, 12, 24, and 48 h. Values are mean ± s.d. (n = 3)
