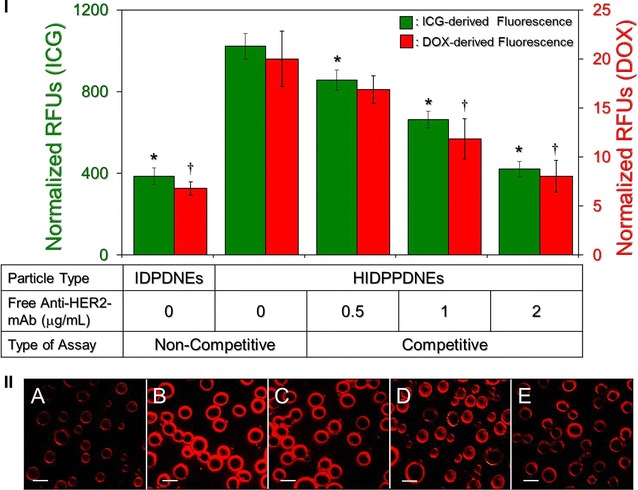
Fig. 7.

Verification of HER2-binding specificity of the HIDPPDNEs. I The upper panel shows the analyses of the fluorescence levels expressed from the MDA-MB-453 cells after treated with the IDPDNEs and/or HIDPPDNEs with and without free anti-HER2-mAb. Both types of nanodroplets were used in 1-µM ICG/0.5-µM DOX equivalent concentration to the cells. For the non-competitive assay, cells were treated with IDPDNEs or HIDPPDNEs in the absence of free anti-HER2-mAb for 4 h. For the competitive assay, cells were separately treated with the HIDPPDNEs in the presence of 0.5, 1, or 2 μg/mL of free anti-HER2-mAb at 37 °C for 4 h. Both ICG- and DOX-derived fluorescence were simultaneously detected right after the nanodroplets were removed. The intensities of the fluorescence were measured using spectrofluorometry performed with excitation/emission wavelength of 750/838 and 485/590 nm for detection of ICG and DOX, respectively, and were quantitatively represented by RFUs. Values are mean ± s.d. (n = 3). *P < 0.05 as compared to the ICG-derived RFUs obtained from the HIDPPDNE-treated group without free anti-HER2-mAb. † P < 0.05 as compared to the DOX-derived RFUs obtained from the HIDPPDNE-treated group without free anti-HER2-mAb. II The bottom panel shows the DOX-derived fluoromicrographic images of MDA-MB-453 cells after co-cultured with the IDPDNEs (A) or HIDPPDNEs (B–E) in the absence (A, B) and presence of 0.5- (C), 1- (D), or 2-(E) μg/mL free anti-HER2-mAb for 4 h. All images were photographed at ×200 magnification. Scale bar 10 μm
