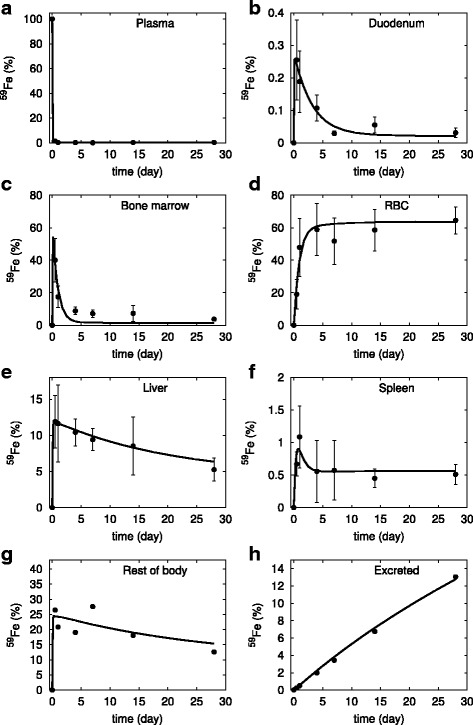
Fig. 2.

Simulation of the calibrated model (#6 in Table 2) against the experimental data of 59Fe injection in mice under adequate iron diet. Continuous line is the model simulation, while filled circles represent the data from [23] (vertical bars represent one standard deviation). The abscissa represents the proportion of total injected 59Fe, the ordinate is time after injection. a plasma, (b) duodenum, (c) bone marrow, (d) red blood cells, (e) liver, (f) spleen, (g) rest of body, and (h) excreted. Note that the standard deviation in panel (a) is smaller than the size of the symbols, while in panels (g) and (h) it was not indicated as it is very large because these data are algebraic sums of various terms
