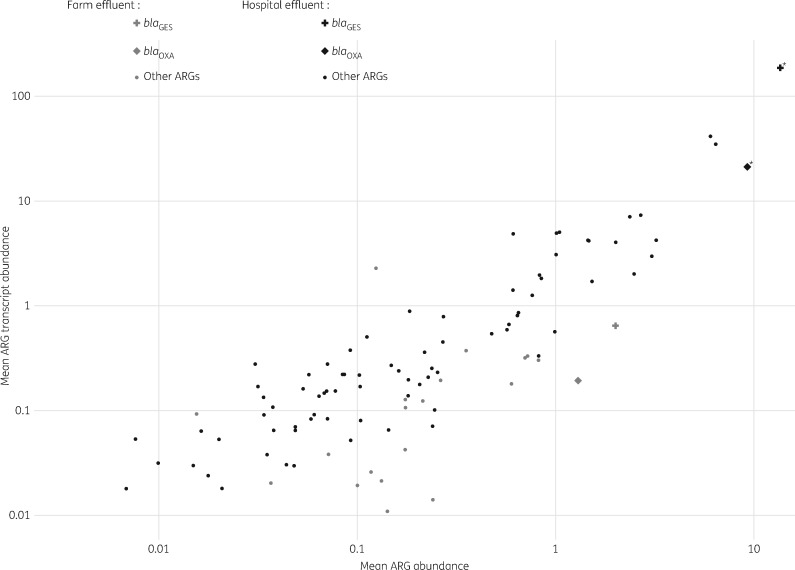
Figure 2.
Mean ARG and ARG transcript abundance for all hospital effluent and farm effluent samples. Mean ARG and ARG transcript abundances were highly correlated for hospital (ρ = 0.9, two-tailed P <0.0001) and farm (ρ = 0.5, two-tailed P <0.0001) effluents. β-Lactam resistance genes blaGES and blaOXA are indicated by plus and diamond symbols, respectively. Asterisks indicate overexpressed genes (blaGES and blaOXA) as determined by t-test and FDR of log DNA:RNA abundance values.

