
Fig. 1.
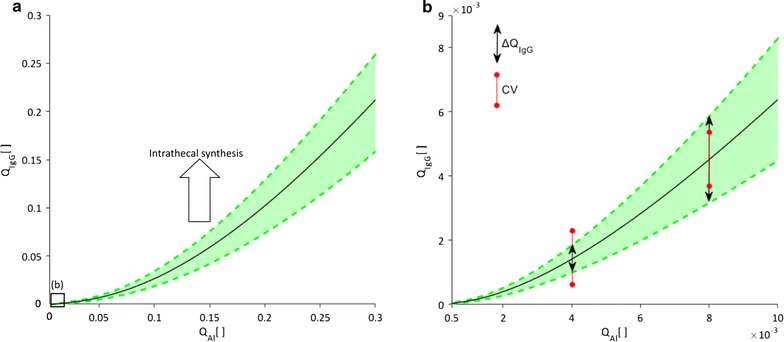
Variation of the immunoglobulin G quotient with that of albumin as depicted in Reiber diagrams. a Displays the empirically established relationship between the concentration of IgG in CSF relative to its concentration in blood serum (IgG quotient, QIgG) and the correspondingly defined albumin quotient (QAl). b Depicts the normal range of albumin quotients, corresponding to the area in a marked with the black square. Reiber demonstrated that the average quotient variation (black line) and upper and lower bounds (green dashed lines) follow the hyperbolic function [32]. He also showed that the population variation coefficient (CV), defined for a given albumin quotient as , remains constant over the entire range of investigated albumin quotients. QIgG values above the upper bound are indicative of a blood-CNS barrier dysfunction