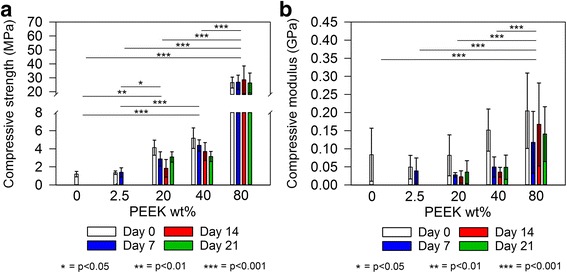
Fig. 7.

(a) Compressive strength and (b) Compressive modulus of PEEK/CS specimens after heat treatment and during ageing. Bar colouration is representative of ageing time as indicated by the legend. Error bars represent standard deviation (n = 10) and lines above data columns represent significant differences between groups based on PEEK wt% loading as found by post-hoc Turkey HSD tests following two-way ANOVA analysis
