
Fig. 2.
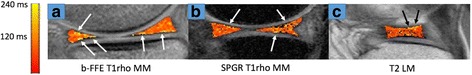
Representative color maps demonstrate T1rho (a and b) and T2 (c) relaxation times are higher in superficial zones than deep zones in the horizontal zonal analysis. These images are from different subjects
Official websites use .gov
A
.gov website belongs to an official
government organization in the United States.
Secure .gov websites use HTTPS
A lock (
) or https:// means you've safely
connected to the .gov website. Share sensitive
information only on official, secure websites.
Representative color maps demonstrate T1rho (a and b) and T2 (c) relaxation times are higher in superficial zones than deep zones in the horizontal zonal analysis. These images are from different subjects