
Fig. 3.
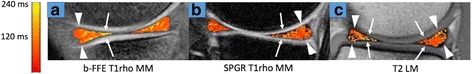
Representative color maps demonstrated T1rho relaxation times of white zone (arrows) are higher than red zone (arrow heads) in MMAH (a) and MMPH (b) in the vertical zonal analysis. T2 relaxation time of the white zone is higher than red zone in LMAH, but lower in LMPH (c). These images are from different subjects