
Fig. 2.
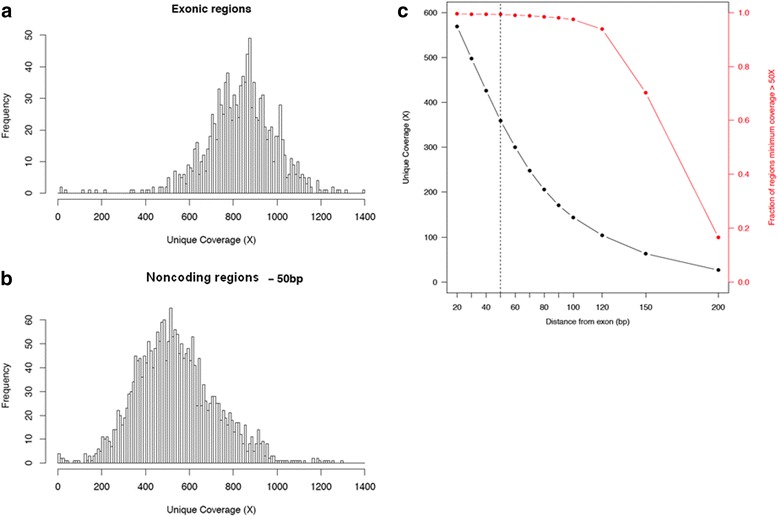
Distribution of sequence coverage. a exons of canonical transcripts of 76 cancer predisposition genes within the MSK-IMPACT panel, b intronic regions flanking targeted exons (50 bp). c Average sequence coverage decreases with increasing distance from the exon-intron boundary (black line), while the fraction of intronic regions flanking the exons that maintain a minimum of 50× coverage (red line) drops off sharply as the size of the flanking regions exceed 100 bp. Dotted line indicates 50 bp