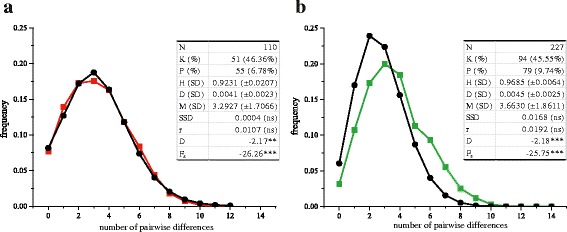
Fig. 2.

Mismatch distributions for Huelva (a) and Granada (b) and statistical parameters of control region sequences. For both cases, expected distributions are shown in black. K: number of different sequences and percentage of sample size in parentheses; P: number of polymorphic sites; H: haplotype diversity and standard deviation; D: nucleotide diversity; M: mean number of pairwise differences; SSD: sum of squared deviations between the observed and expected mismatch distribution; r: Harpending’s raggedness index; D and Fs are, respectively, the Tajima’s and Fu’s tests of selective neutrality. The last 4 indices are presented with their significance values, as ns (non-significant), **P < 0.01; ***P < 0.001
