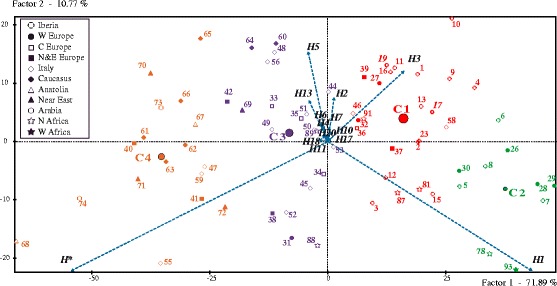
Fig. 5.

Hierarchical Cluster Analysis (HCA) of 71 populations based on their Hg H sub-structure. Only high-resolution studies were considered for this analysis (see populations underlined in Additional file 4). The sub-clades used here are depicted as vectors. Affiliation to each of 4 clusters discussed in the text is colour-coded. Each geographic affiliation has a characteristic symbol (see legend). Populations are coded as in Additional file 4. Our Andalusian populations correspond to numbers 17 (Huelva) and 19 (Granada)
