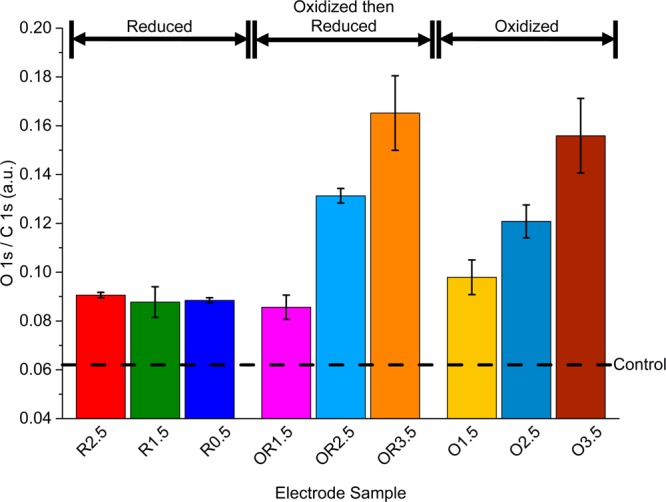
Figure 1.

Oxygen content of each electrode given by the O 1s integrated peak area normalized to the C 1s integrated peak area. O 1s/C 1s values displayed were taken as the average of three measurements. The dashed line corresponds to the unpolarized control electrode oxygen content. The error bars correspond to the standard deviation of the measurements for each electrode.
