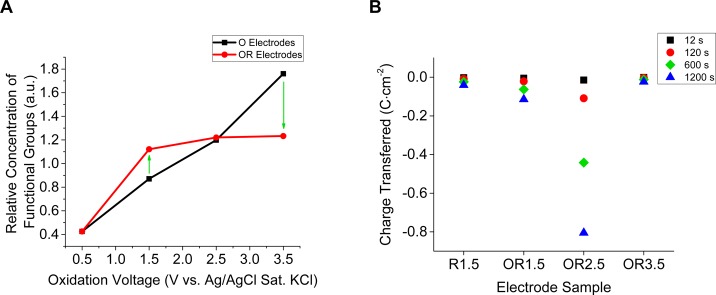
Figure 3.
(A) Comparison of relative amount of functional groups between O and OR electrodes. The O electrodes were oxidized at the given oxidation voltage for 20 min. O electrodes that were subsequently reduced at −1.5 V vs Ag/AgCl for 20 min are renamed OR electrodes. The relative amount of functional groups before, and after reduction of the oxidized electrodes indicates presence, and stability dependent on the oxidation voltage. Oxidation voltage of 0.5 V corresponds to the relative amount of functional groups on the control electrode. The green arrows indicate instability of the oxidized surface in reducing environment at the given voltages. (B) Charge transfer for the R1.5 and OR electrodes at discrete times during reduction at −1.5 V vs Ag/AgCl sat. KCl for 20 min. The charge transferred for the OR1.5 and OR2.5 electrodes compared to R1.5 indicates there is greater charge transferred during reduction if BD-UNCD is “pre-anodized” at either 1.5 or 2.5 V. However, OR1.5 and OR2.5 compared to OR3.5 shows that too high of an oxidation voltage during “pre-anodization” removes this effect. Charge transfer is proportional to oxygen reduction, and therefore hydrogen peroxide production in acidic aqueous environments.

