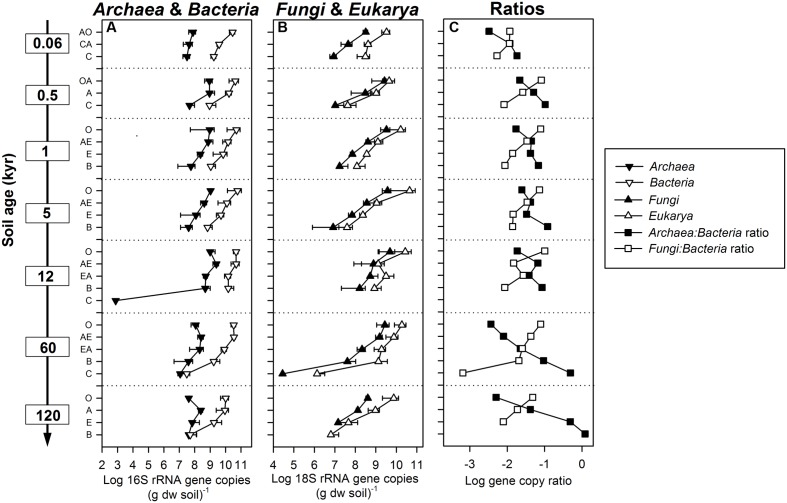
FIGURE 1.
Abundances of SSU rRNA gene copies in different soil horizons (O, OA, A, AO, AE, E, EA, B, C, CA) from depth profiles of 0.06, 0.5, 1, 5, 12, 60, and 120 kyr old soils along the Franz Josef chronosequence. (A) Archaea and Bacteria 16S (assay Nadkarni et al., 2002), and (B) Fungi and Eukarya 18S rRNA gene copy numbers per gram soil dry weight (dw). Error bars indicate standard deviation of three parallel soil profiles. (C) Ratio of archaeal to bacterial, and fungal to bacterial SSU rRNA gene copy numbers.

