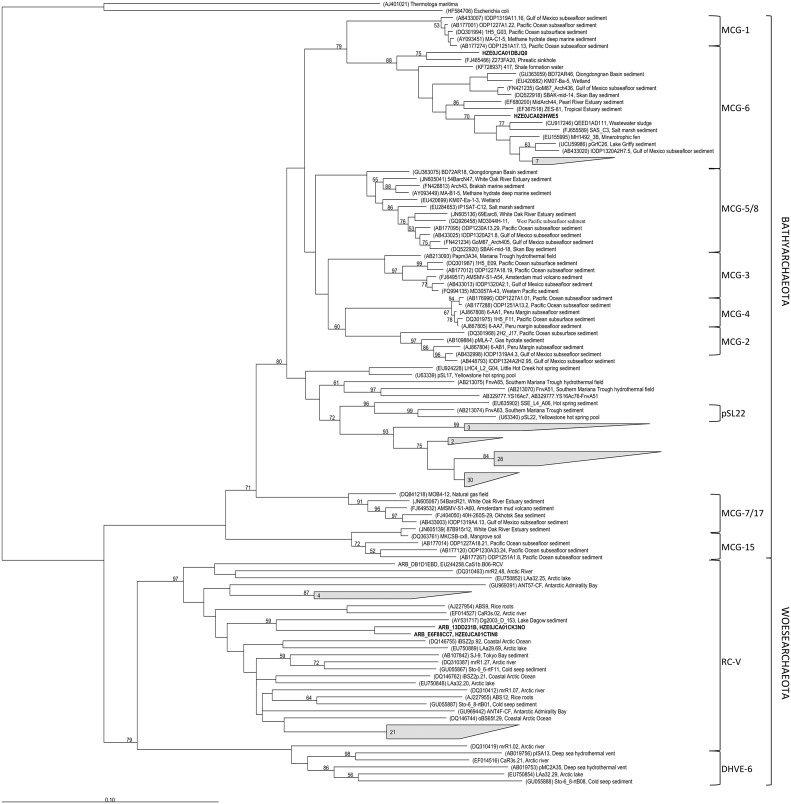
FIGURE 3.
Phylogenetic affiliation of Bathyarchaeota and Woesearchaeota 16S rRNA gene sequences from soils along the Franz Josef chronosequence (in bold or grouped as gray-shaded form including the number of the respective sequences). Bootstrap values (in percent) are based on 1000 replicates (values below 50% are not shown). The scale bar indicates 10% estimated phylogenetic divergence.

