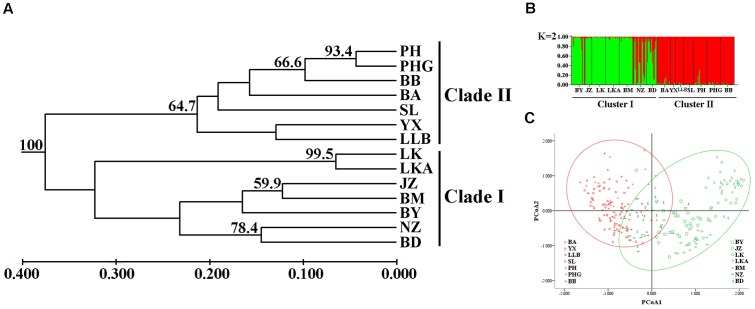
FIGURE 6.
(A) An unweighted pair-group method with arithmetic averages (UPGMA) phenogram (numbers on branches indicate bootstrap values from 5,000 replicates), (B) Bayesian inference using STRUCTURE (K = 2) and (C) Principal coordinates analysis (PCoA) of SSR phenotype from 14 populations of 238 individuals of C. segmentifida.

