. 2017 Mar-Apr;19(87):65–72. doi: 10.4103/nah.NAH_73_16
Copyright: © 2017 Noise & Health
This is an open access article distributed under the terms of the Creative Commons Attribution-NonCommercial-ShareAlike 3.0 License, which allows others to remix, tweak, and build upon the work non-commercially, as long as the author is credited and the new creations are licensed under the identical terms.
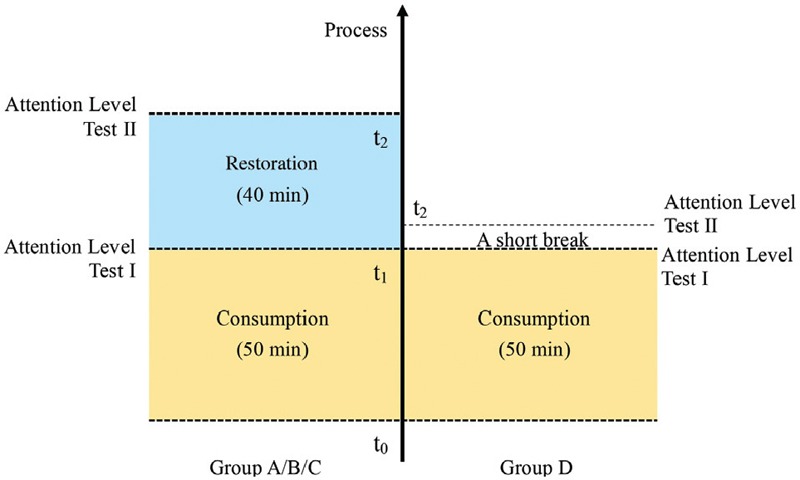
Figure 3.

Experimental flow chart
