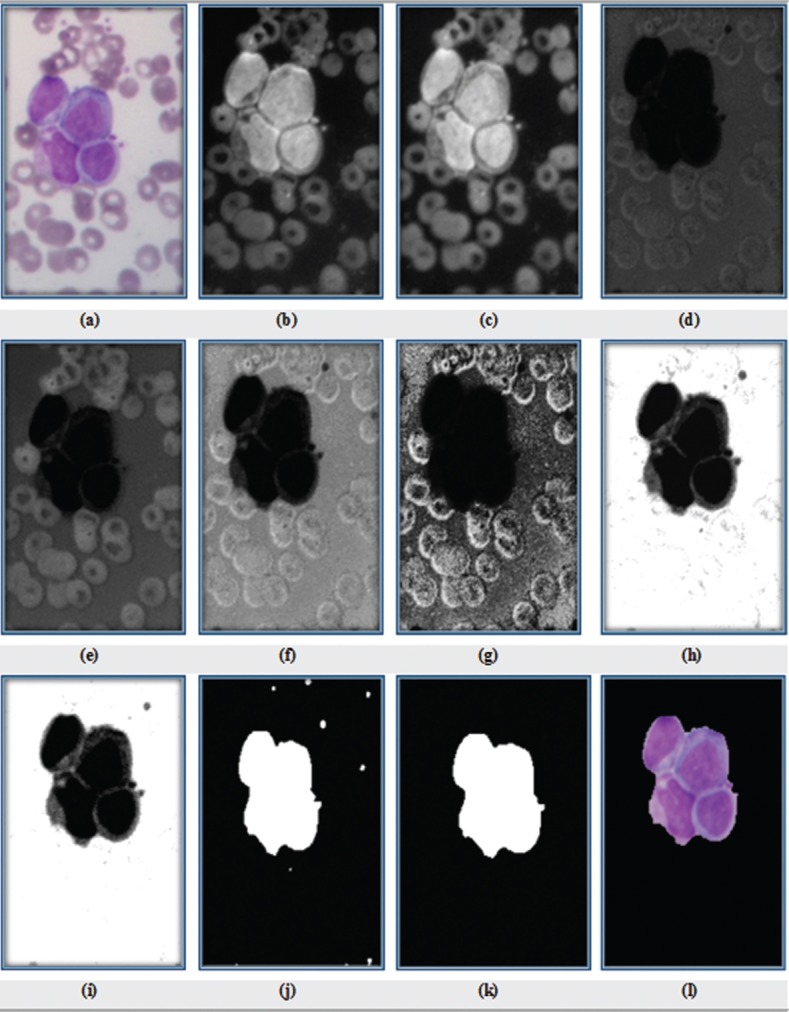
Figure 2.

(a) Original RGB image; (b) C sub-band; (c) M sub-band; (d) Y sub-band; (e) K sub-band; (f) linear contrast stretching of Y image (L); (g) histogram equalization of Y image (H); (h) enhanced image; (i) filtered image of h; (j) mask cells after thresholding; (k) result of cell segmentation after applying morphological operations; and (l) RGB image of cells
