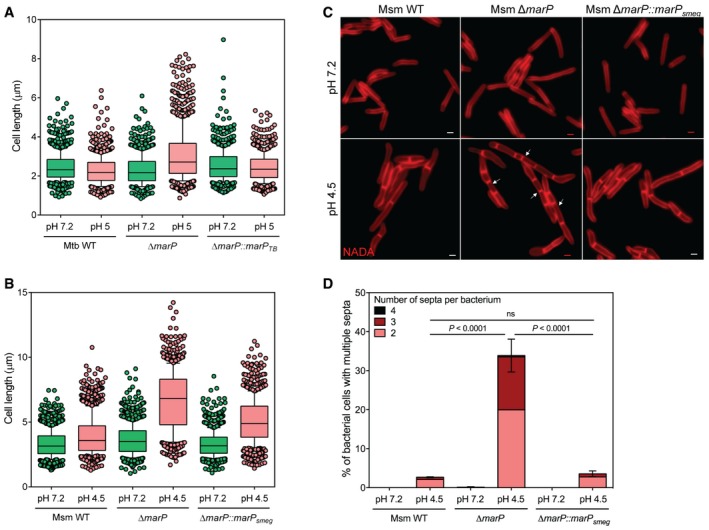
Boxplot of the lengths (μm) of Mtb WT, ΔmarP, and ΔmarP::marP
TB incubated for 7 days in Sauton's medium at pH 7.2 or pH 5 measured in three independent experiments. Lower and upper whiskers extend to the 10th and 90th percentiles, respectively. The middle bar represents the median and the lower and upper box limits are the 25th and 75th percentiles. For Mtb WT pH 7.2, n = 186, 343, 351; pH 5, n = 298, 278, 238. For ΔmarP pH 7.2, n = 210, 183, 422; pH 5, n = 180, 419, 365. For ΔmarP::marP
TB pH 7.2, n = 163, 235, 305; pH 5, n = 247, 258, 297. n indicates the number of cells in experiments 1, 2, and 3. Adjusted P‐values compared to WT pH 7.2: ΔmarP pH 7.2, P = 1; ΔmarP::marP
TB pH 7.2, P = 5.8 × 10⁻⁴. Adjusted P‐values compared to WT pH 5: ΔmarP pH 5, P = 1.8 × 10−56
; ΔmarP::marP
TB pH 5, P = 1.4 × 10⁻⁶. P‐values have been computed using the Ranksum test adjusted for multiple testing.
Boxplot of the lengths (μm) of Msm WT, ΔmarP, and ΔmarP::marP
smeg incubated for 24 h in Sauton's medium at pH 7.2 or pH 4.5, measured in three independent experiments. Lower and upper whiskers extend to the 10th and 90th percentiles, respectively. The middle bar represents the median and the lower and upper box limits are the 25th and 75th percentiles. For Msm WT pH 7.2, n = 309, 431, 444; pH 4.5, n = 142, 327, 546. For ΔmarP pH 7.2, n = 205, 465, 610; pH 4.5, n = 259, 268, 279. For ΔmarP::marP
smeg pH 7.2, n = 249, 464, 577; pH 4.5, n = 239, 358, 234. n indicates the number of cells in experiments 1, 2, and 3. Adjusted P‐values compared to WT pH 7.2: ΔmarP pH 7.2, P = 1.3 × 10⁻⁴
; ΔmarP::marP
smeg pH 7.2, P = 0.22. Adjusted P‐values compared to WT pH 4.5: ΔmarP pH 4.5, P = 3.3 × 10−124
, ΔmarP::marP
smeg pH 4.5, P = 4.2 × 10⁻²⁵. P‐values have been computed using the Ranksum test adjusted for multiple testing.
Representative images of Msm WT, ΔmarP, and ΔmarP::marP
TB incubated for 24 h in Sauton's medium at pH 7.2 or pH 4.5 in the presence of 1 mM of the D‐alanine analog NADA (red). Arrows show examples of bacteria that formed chains. Scale bars, 1 μm.
Quantification of the number of bacteria that contained at least two septa for Msm WT, ΔmarP, and ΔmarP::marP
TB after 24 h of incubation at pH 7.2 or pH 4.5 in three independent experiments. Error bars represent SEM. P‐values were determined using a logistic regression model and were adjusted for multiple comparisons.